Application Insights - Telemetry
1. How do I instrument (monitor/record/enabling to capture telemetry) an application?
Autoinstrumentation - if you don’t have access to source code
You only need to install the Application Insights SDK if:
The instrumentation, monitors your app and directs the telemetry data to an Application Insights resource by using a unique token. The effect on your app’s performance is small. Tracking calls are nonblocking.
Instrumentation Options - there are two different methods available:
- Automatic instrumentation (less configurable)
- Manual instrumentation
Manual instrumentation involves writing code that interacts with or uses Application Insights in some way.
There are two options for manual instrumentation:
Application Insights SDKs
Step 1: Create an Application Insights resource:
- Go to the Azure portal (https://portal.azure.com).
- Click on “+ Create a resource” in the upper left corner.
- Search for “Application Insights” and select it.
- Click the “Create” button and follow the steps to create a new Application Insights resource. Make sure to choose the appropriate settings for your application.
Step 2: Get the Instrumentation Key:
- After creating the Application Insights resource, go to the “Overview” page of your resource in the Azure portal.
- You will find an “Instrumentation Key” on this page. Copy this key; you will need it in the next steps.
2. Enable Application Insights server-side telemetry
Step 1. Install the Application Insights SDK NuGet package for ASP.NETCore
Step 2. Add AddApplicationInsightsTelemetry() to your Startup.cs or Program.cs class. The choice depends on your .NET Core version.
Step 3. Add builder.Services.AddApplicationInsightsTelemetry(); after the WebApplication.CreateBuilder(); method in your Program class, as in this example:
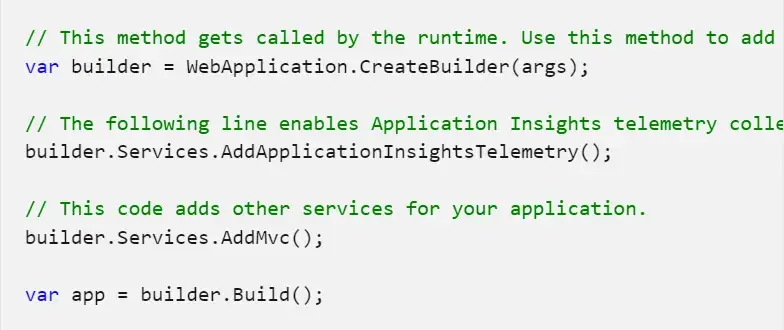
Example code (Program.cs)
Step 4. Set up the connection string. Although you can provide a connection string as part of the ApplicationInsightsServiceOptions argument to AddApplicationInsightsTelemetry, we recommend that you specify the connection string in configuration. The following code sample shows how to specify a connection string in appsettings.json. Make sure appsettings.json is copied to the application root folder during publishing.
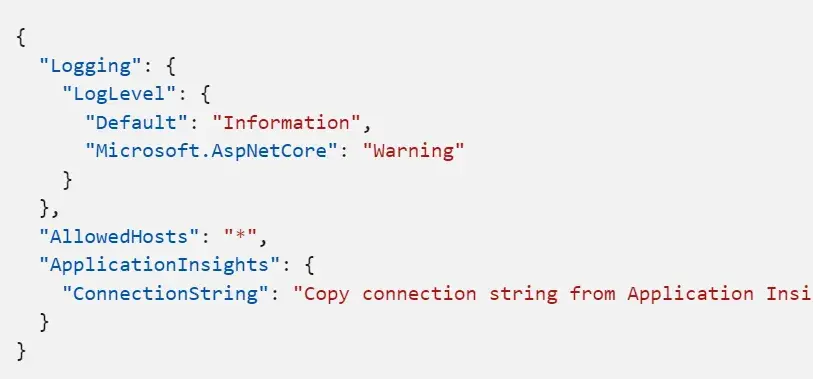
Alternatively, specify the connection string in the APPLICATIONINSIGHTS_CONNECTION_STRING environment variable or ApplicationInsights:ConnectionString in the JSON configuration file.
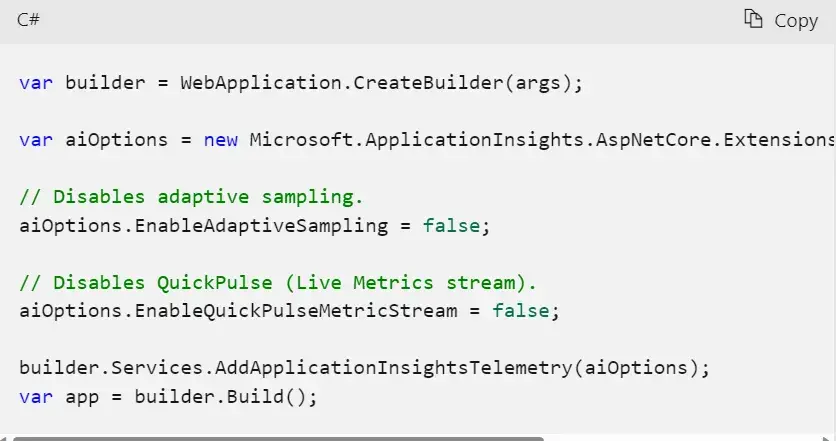
Step 5. Configure the Application Insights SDK
You can modify a few common settings by passing ApplicationInsightsServiceOptions to AddApplicationInsightsTelemetry, as in this example:
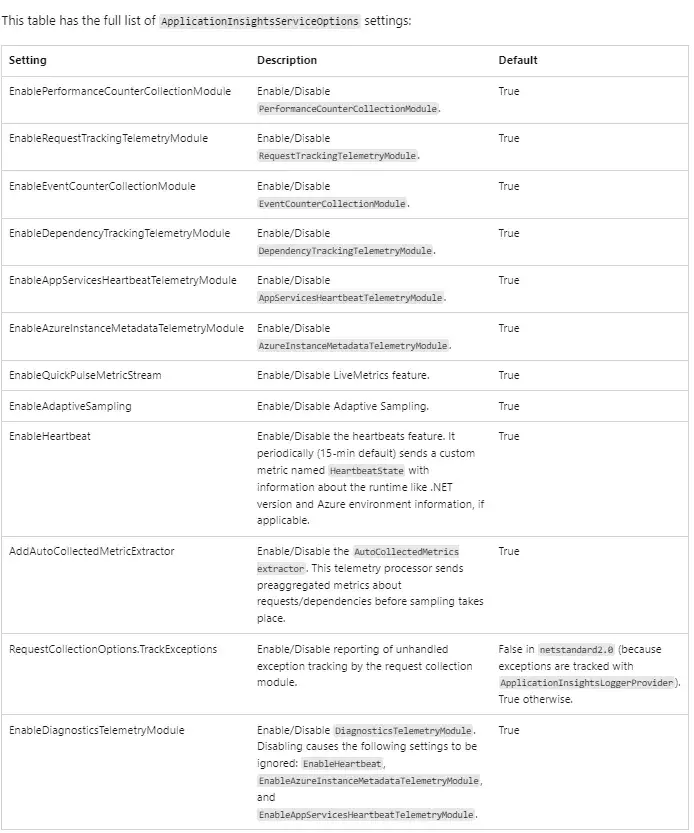
Available options
3. Add TelemetryInitializers
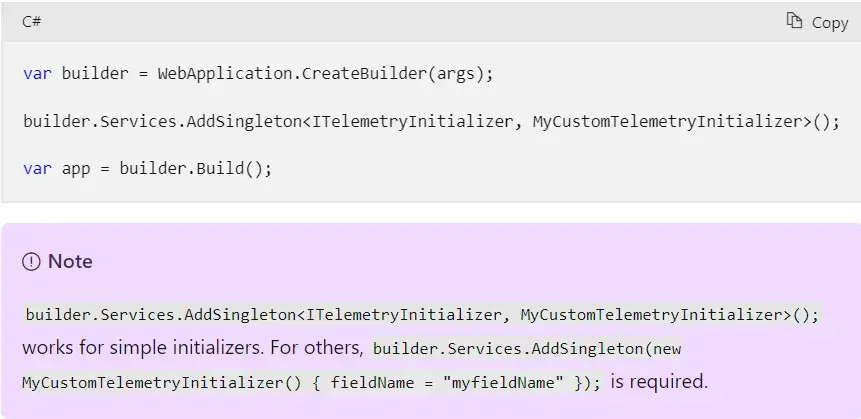
When you want to enrich telemetry with more information, use telemetry initializers. Add any new TelemetryInitializer to the DependencyInjection container as shown in the following code. The SDK automatically picks up any TelemetryInitializer that's added to the DependencyInjection container.
Note: it is added as Singleton.
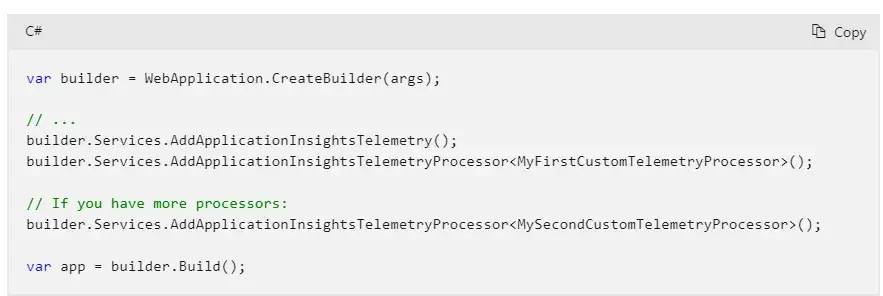
4. Add telemetry processors
You use telemetry processors in advanced filtering scenarios.
5. Configure or remove default TelemetryModules
Application Insights automatically collects telemetry about specific workloads without requiring manual tracking by user.
By default, the following automatic-collection modules are enabled. These modules are responsible for automatically collecting telemetry. You can disable or configure them to alter their default behavior.
RequestTrackingTelemetryModule: Collects RequestTelemetry from incoming web requests.DependencyTrackingTelemetryModule: Collects DependencyTelemetry from outgoing HTTP calls and SQL calls.PerformanceCollectorModule: Collects Windows PerformanceCounters.QuickPulseTelemetryModule: Collects telemetry to show in the Live Metrics portal.AppServicesHeartbeatTelemetryModule: Collects heartbeats (which are sent as custom metrics), about the App Service environment where the application is hosted.AzureInstanceMetadataTelemetryModule: Collects heartbeats (which are sent as custom metrics), about the Azure VM environment where the application is hosted.EventCounterCollectionModule: Collects EventCounters. This module is a new feature and is available in SDK version 2.8.0 and later.
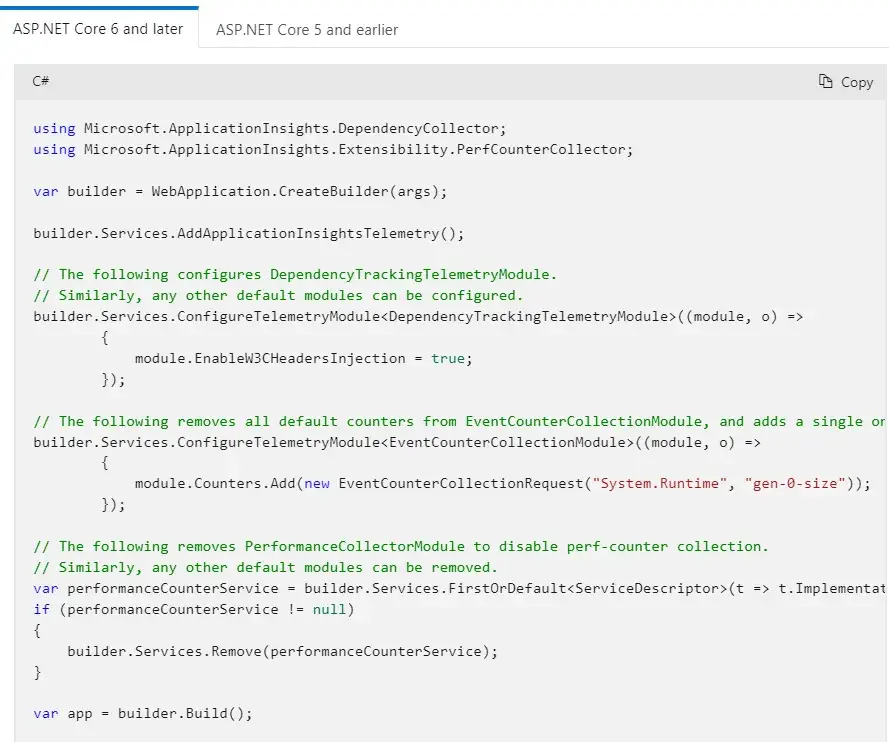
To configure any default TelemetryModule, use the extension method ConfigureTelemetryModule<T> on IServiceCollection, as shown in the following example:
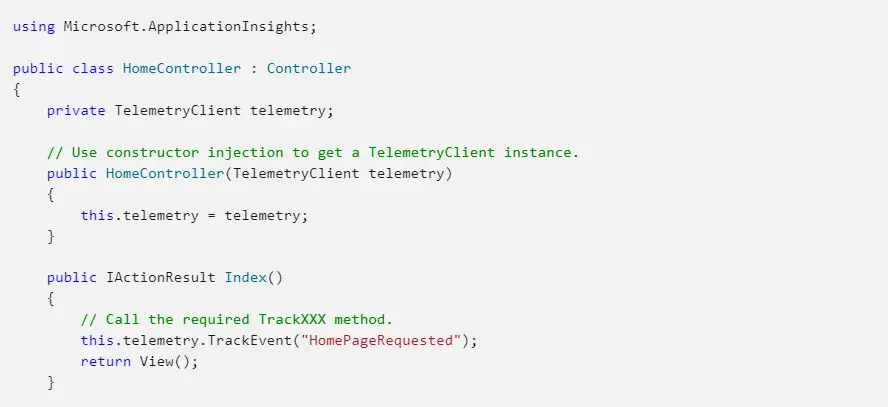
6. How can I track telemetry that’s not automatically collected?
Get an instance of TelemetryClient by using constructor injection and call the required TrackXXX() method on it. I don't recommend creating new TelemetryClient or TelemetryConfiguration instances in an ASP.NET Core application. A singleton instance of TelemetryClient is already registered in the DependencyInjection container, which shares TelemetryConfiguration with the rest of the telemetry.
References