Reporting is a common task in business applications, and for that, ComponentOne includes a specialized FlexReport library that allows you to make complex reports. But sometimes, using specialized tools can be too tricky or not flexible enough.
For example, if you wanted to generate a report “from scratch” by printing text to a document word by word, a reporting library would not be the best tool.
Reporting libraries are over-engineered by design to make it quick and easy. For more flexible and from-the-ground-up solutions, ComponentOne includes another component: C1PrintDocument.
About C1PrintDocumentt — An Extended C# PrintDocument Component
C1PrintDocument provides an extensive and feature-rich document object model (DOM), with support for various layouts (inline, stacked), ambient and hierarchical styles, infinitely nested tables, table of contents, detailed control over pagination (orphan/widow, page size/headers/footers, etc.), etc. On top of all that, it also has a data binding layer.
You can download the C1PrintDocument component as part of the C1.Win.Printing NuGet package (WinForms version) or C1.Xaml.WPF.PrintDocument (WPF version). It supports .NET 6 and higher with C# or VB.NET code.
Once you are familiar with it, you can relatively easily in code create pretty complex and flexible documents that then can be viewed, printed, saved, or exported in PDF (Portable Document Format), RTF (Rich Text File), MS Excel, and other formats.
If you need to print arbitrary text with pagination and different layout options, you can start using this simple code:
Hello World” with C1PrintDocument
var doc = new C1.C1Preview.C1PrintDocument();
doc.Body.Children.Add(new C1.C1Preview.RenderText(doc, "Hello World!"));
doc.Generate();
var preview = new C1.Win.RibbonPreview.C1RibbonPreviewDialog();
preview.Document = doc;
preview.ShowDialog();
That’s it. You can play with page settings in the preview dialog to see that your content reflows and can be paginated without any code from your side.
If you need a more complex report-like application, you need to define the layout of elements and use data binding to generate elements according to your data. To show how you can do that, we SimpleReports sample that can be downloaded as a zip file. Now let’s talk about some individual samples and technics.
Create the Simple Report
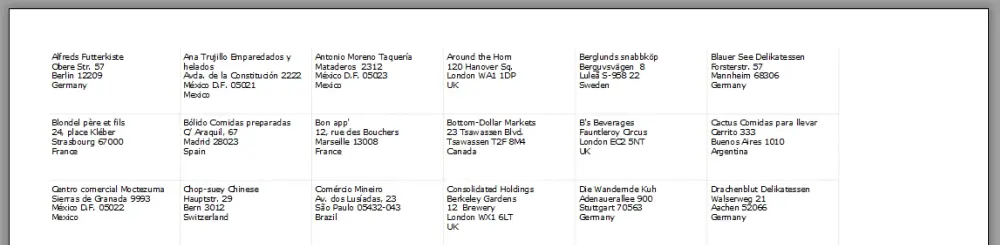
The most uncomplicated “Customer Labels” sample shows labels flowing in the left to the right direction, as many labels on a single page as can fit.
To compose C1PrintDocument, you should use elements derived from the RenderObject class and add them to the C1PrintDocument.Body.
Children collection in the same way as you add the controls to control.Controls collection in WinForms application. Elements can be nested and use parent object binding as a data source.
RenderArea is a render object that is specifically a container for child objects. By default, when a new RenderArea is created, its width is equal to the width of its parent area.
For RenderArea, specifying the width or height as “Unit.Auto” means that the size of the children determines the appropriate size.
Within their container (parent object or document body), render objects by default are placed according to the stacking rules, determined by the value of the Stacking property of the container (document for top-level objects).
This value can be one of the following StackingRulesEnum enumeration members:
- BlockTopToBottom: Objects are placed one beneath the other within the container. When the bottom edge of the current page is reached, a new page is added. This is the default;
- BlockLeftToRight: Objects are placed one next to another, from left to right. When the right edge of the current page is reached, a new “horizontal” page is added (a horizontal page logically extends the preceding page to the right;
- InlineLeftToRight: Objects are placed inline, one next to another, from left to right. When the right edge of the current page is reached, the sequence wraps to the next line. A new page is added when the bottom of the current page is reached.
The layout of the “Customer Labels” document consists of several key elements:
- The outer RenderArea object “raContainer” serves as a container for all labels.
- The RenderArea object “raItem” representing a single label.
- The RenderText object “rt” representing label content.
Here is what it should look like:
Let me show you some code with more details:
Customer Labels Code
RenderArea raContainer = new RenderArea();
raContainer.Stacking = StackingRulesEnum.InlineLeftToRight;
_printDocument.Body.Children.Add(raContainer);
DataSource ds = CreateDemoDataSource();
DataSet dsCustomers = new DataSet(ds, "SELECT CompanyName, Address, City, PostalCode, Country FROM Customers ORDER BY CompanyName");
_printDocument.DataSchema.DataSets.Add(dsCustomers);
RenderArea raItem = new RenderArea();
raItem.Style.Borders.Right = new LineDef("0.1pt", Color.LightGray, System.Drawing.Drawing2D.DashStyle.Dot);
raItem.Style.Borders.Bottom = new LineDef("0.1pt", Color.LightGray, System.Drawing.Drawing2D.DashStyle.Dot);
raItem.Width = "40mm";
raItem.Height = "20mm";
raItem.SplitVertBehavior = SplitBehaviorEnum.Never;
raItem.DataBinding.DataSource = dsCustomers;
raContainer.Children.Add(raItem);
RenderText rt = new RenderText();
rt.Text = "[Fields!CompanyName.Value]\r\n[Fields!Address.Value]\r\n[Fields!City.Value] [Fields!PostalCode.Value]\r\n[Fields!Country.Value]";
raItem.Children.Add(rt);
_printDocument.Generate();
In the above code text of each label is composed of data-bound fields using the scripting language. During document generation, the C1PrintDocument will calculate these fields and print actual values. You can read more about text expressions here.
Using the Groups
C1PrintDocument allows you to use expressions to group your data. The “Alphabetical List of Products” sample groups products by the first letter of the product name. It allows you to show a nice formatted list of products:
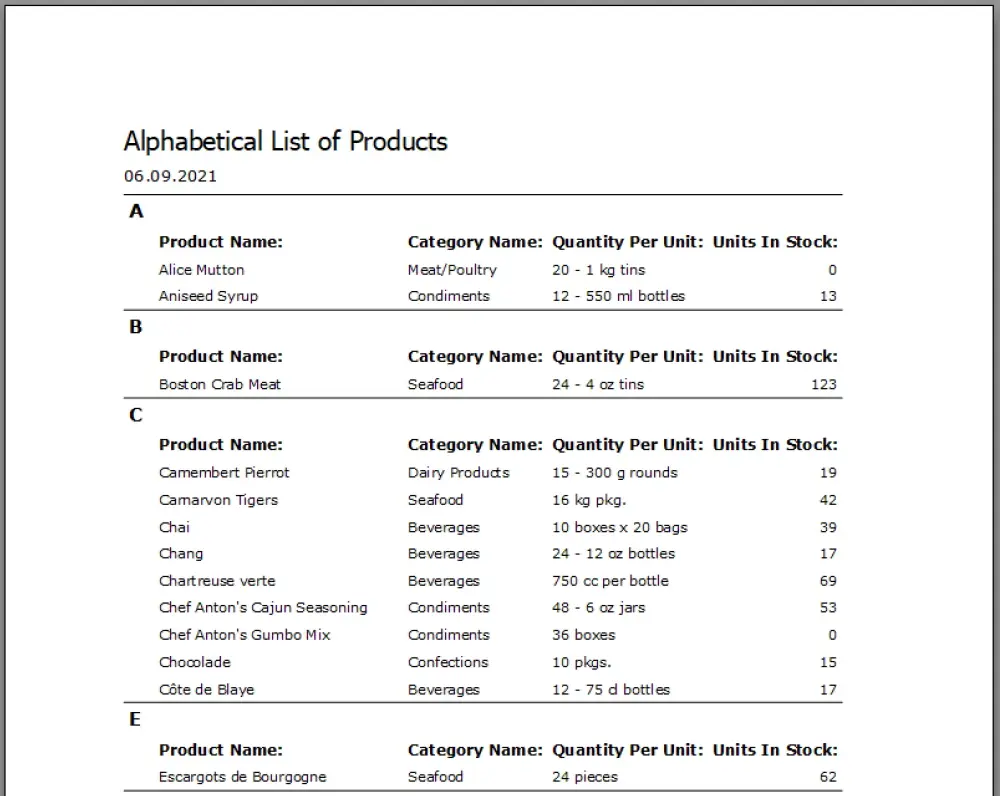
This sample layouts data in a table form. The table is created using the RenderTable class. The size of tables is not limited and determined at render time by the cell with the highest row and column numbers whose contents have been set.
Row and column indices start at zero. By default, the size of the table is equal to the width of the parent element’s client area. Row heights are set automatically to match the largest content height in a row.
Alphabetical List of Products Code
DataSource ds = CreateDemoDataSource();
DataSet dsProducts = new DataSet(ds,
"SELECT Left(p.ProductName, 1) AS FirstLetter, p.ProductName, p.QuantityPerUnit, p.UnitsInStock, c.CategoryName " +
"FROM Categories c, Products p " +
"WHERE c.CategoryID = p.CategoryID " +
"ORDER BY p.ProductName");
_printDocument.DataSchema.DataSources.Add(ds);
_printDocument.DataSchema.DataSets.Add(dsProducts);
RenderTable rt = new RenderTable();
TableVectorGroup tvg = rt.RowGroups[0, 3];
tvg.DataBinding.DataSource = dsProducts;
tvg.DataBinding.Grouping.Expressions.Add("Fields!FirstLetter.Value");
rt.Cells[0, 0].Text = "[Fields!FirstLetter.Value]";
rt.Cells[0, 1].SpanCols = 4;
rt.Cells[1, 1].Text = "Product Name:";
rt.Cells[1, 2].Text = "Category Name:";
rt.Cells[1, 3].Text = "Quantity Per Unit:";
rt.Cells[1, 4].Text = "Units In Stock:";
rt.Cells[2, 1].Text = "[Fields!ProductName.Value]";
rt.Cells[2, 2].Text = "[Fields!CategoryName.Value]";
rt.Cells[2, 3].Text = "[Fields!QuantityPerUnit.Value]";
rt.Cells[2, 4].Text = "[Fields!UnitsInStock.Value]";
tvg = rt.RowGroups[2, 1];
tvg.DataBinding.DataSource = dsProducts;
_printDocument.Body.Children.Add(rt);
_printDocument.Generate();
Note: ranges of groups must not overlap.
Using the Expressions
Expressions (or scripts) are used in C1PrintDocument to extract, calculate, display, group, sort, filter, parameterize, and format the contents, and extend a report’s functionality. You can read more about scripts here.
Visual Basic is used as the expression language by default. To use c# change ScriptingOptions.Language property.
The “Employees” sample uses scripts to insert photos into the generated document:
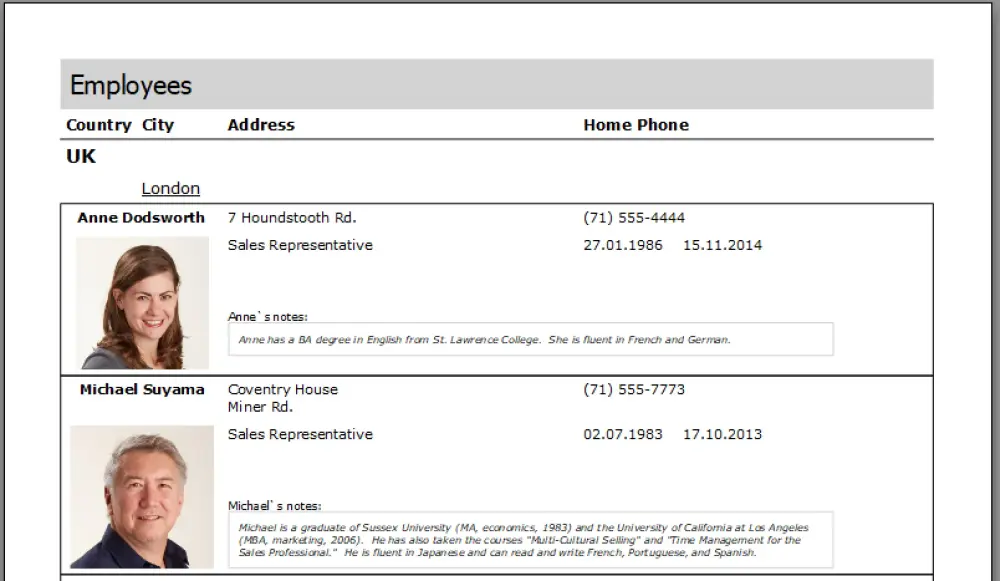
The sample uses the FormatDataBindingInstanceScript property to set a script executed each time a new instance of the current RenderObject is created due to data binding resolving.
Employees Code
DataSet dsEmployers = new DataSet(ds,
"SELECT EmployeeID, LastName, FirstName, Title, TitleOfCourtesy, BirthDate, HireDate, Address, City, Region, PostalCode, Country, HomePhone, Extension, Notes, ReportsTo, Photo " +
"FROM Employees " +
"ORDER BY Country, City, FirstName, LastName");
_printDocument.DataSchema.DataSources.Add(ds);
_printDocument.DataSchema.DataSets.Add(dsEmployers);
RenderTable rt = new RenderTable();
rt.Cells[0, 0].Text = "Country";
rt.Cells[0, 1].Text = "City";
rt.Cells[0, 2].Text = "Address";
rt.Cells[0, 3].Text = "Home Phone";
rt.Cells[1, 0].Text = "[Fields!Country.Value]";
rt.Cells[2, 1].Text = "[Fields!City.Value]";
rt.Cells[3, 0].Text = "[Fields!FirstName.Value] [Fields!LastName.Value]";
rt.Cells[3, 0].SpanCols = 2;
rt.Cells[3, 2].Text = "[Fields!Address.Value]";
rt.Cells[3, 3].Text = "[Fields!HomePhone.Value]";
RenderImage ri = new RenderImage(_printDocument);
_printDocument.ThrowExceptionOnError = true;
_printDocument.AddWarningsWhenErrorInScript = true;
ri.FormatDataBindingInstanceScript = @"
' get ri object
Dim ri as RenderImage = DirectCast(RenderObject, RenderImage)
' get DB BLOB object as byte array
Dim picData as Byte() = DirectCast(RenderObject.Original.DataBinding.Parent.Fields!Photo.Value, Byte())
Const bmData As Integer = 78
Dim ms as IO.MemoryStream = New IO.MemoryStream(picData, bmData, picData.Length - bmData)
' create image from stream
ri.Image = Image.FromStream(ms)
";
ri.Width = "30mm";
ri.Height = "30mm";
ri.Style.ImageAlign.AlignHorz = ImageAlignHorzEnum.Center;
ri.Style.ImageAlign.AlignVert = ImageAlignVertEnum.Center;
rt.Cells[4, 0].RenderObject = ri;
rt.Cells[4, 0].SpanCols = 2;
rt.Cells[4, 0].SpanRows = 2;
rt.Cells[4, 2].Text = "[Fields!Title.Value]";
rt.Cells[4, 2].Style.Parents = dataStyle;
rt.Cells[4, 3].Text = "[FormatDateTime(Fields!BirthDate.Value, DateFormat.ShortDate)] [FormatDateTime(Fields!HireDate.Value, DateFormat.ShortDate)]";
rt.Cells[4, 3].Style.Parents = dataStyle;
RenderArea raNotes = new RenderArea();
var rtNoteTitle = new RenderText();
rtNoteTitle.Text = "[Fields!FirstName.Value]`s notes:";
var rtNote = new RenderText();
rtNote.Text = "[Fields!Notes.Value]";
raNotes.SplitVertBehavior = SplitBehaviorEnum.Never;
raNotes.Children.Add(rtNoteTitle);
raNotes.Children.Add(rtNote);
rt.Cells[5, 2].RenderObject = raNotes;
TableVectorGroup tvg = rt.RowGroups[2, 6];
tvg.DataBinding.DataSource = dsEmployers;
tvg.DataBinding.Grouping.Expressions.Add("Fields!City.Value");
tvg = rt.RowGroups[0, 8];
tvg.DataBinding.DataSource = dsEmployers;
tvg.DataBinding.Grouping.Expressions.Add("Fields!Country.Value");
tvg = rt.RowGroups[3, 5];
tvg.DataBinding.DataSource = dsEmployers;
tvg.SplitBehavior = SplitBehaviorEnum.Never;
_printDocument.Body.Children.Add(rt);
rt.UserCellGroups[0].Style.Borders.All = new LineDef("0.5pt", Color.Black);
_printDocument.Generate();
Different objects in the C1PrintDocument hierarchy have properties accepting scripts that allow changing appearance on the fly depending on data. For example, you can use style to highlight orders worth $1000 or more with blue color using the .TextColorExpr expression:
Text Color by Condition
rt.Cells[3, 4].Style.TextColorExpr = "iif(Fields!UnitPrice.Value * Fields!Quantity.Value >= 1000, Colors.Blue, Colors.Black)";
Using the Styles
The C1PrintDocument Style property is the root style of the document with which you can set the default appearance of visual components: borders, font, line spacing of a text, etc.
The C1PrintDocument PageLayout. PageSettings property helps set page options for printing to select the size of the paper, page orientation, etc.
For document pages, you can adjust settings using the Style property of the RenderObject class: content margins, page size, etc. This property cannot be assigned. Set the Parent to that other style to use another style as the base for the current object’s style.
Setting Styles
_printDocument.Style.FontName = "Verdana";
_printDocument.Style.FontSize = 10;
_printDocument.PageLayout.PageSettings.LeftMargin = "12mm";
_printDocument.PageLayout.PageSettings.RightMargin = "12mm";
_printDocument.PageLayout.PageSettings.TopMargin = "12mm";
_printDocument.PageLayout.PageSettings.BottomMargin = "12mm";
C1.C1Preview.Style headerStyle = _printDocument.Style.Children.Add();
headerStyle.FontSize = 9;
headerStyle.FontBold = true;
headerStyle.GridLines.Bottom = new LineDef("1pt", Color.Black);
C1.C1Preview.Style countryStyle = _printDocument.Style.Children.Add();
countryStyle.FontSize = 11;
countryStyle.FontBold = true;
C1.C1Preview.Style cityStyle = _printDocument.Style.Children.Add();
cityStyle.FontSize = 10;
cityStyle.FontUnderline = true;
var rtCaption = new RenderText();
rtCaption.Text = "Employees";
rtCaption.Style.FontName = "Tahoma";
rtCaption.Style.FontSize = 16;
rtCaption.Style.Padding.All = "2mm";
rtCaption.Style.BackColor = Color.LightGray;
_printDocument.Body.Children.Add(rtCaption);
RenderTable rt = new RenderTable();
rt.CellStyle.Padding.All = "1mm";
rt.Cells[0, 0].Text = "Country";
rt.Cells[0, 0].Style.Spacing.Top = "2mm";
rt.Cells[0, 0].Style.Parents = headerStyle;
rt.Cells[0, 1].Text = "City";
rt.Cells[0, 1].Style.Parents = headerStyle;
rt.Cells[0, 2].Text = "Address";
rt.Cells[0, 2].Style.Parents = headerStyle;
rt.Cells[0, 3].Text = "Home Phone";
rt.Cells[0, 3].Style.Parents = headerStyle;
rt.Cells[1, 0].Text = "[Fields!Country.Value]";
rt.Cells[1, 0].Style.Parents = countryStyle;
rt.Cells[2, 1].Text = "[Fields!City.Value]";
rt.Cells[2, 1].Style.Parents = cityStyle;
rt.UserCellGroups.Add(new UserCellGroup(new Rectangle(0, 3, 4, 3)));
rt.UserCellGroups[0].Style.Borders.All = new LineDef("0.5pt", Color.Black);
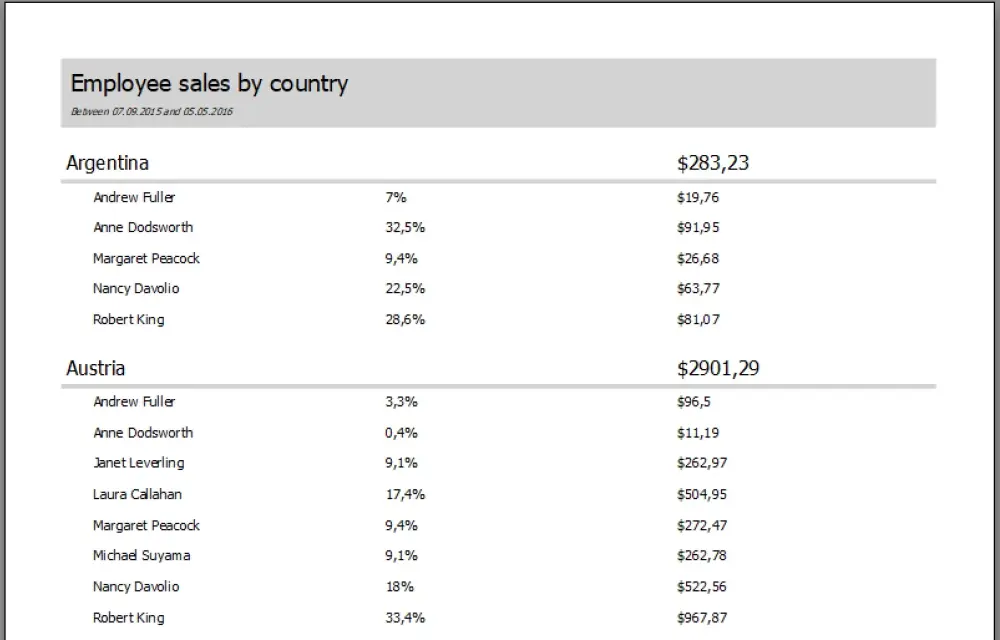
Using the Aggregates
For the average report, just grouping data is not enough. People usually want to see some aggregate values at the bottom. Let’s see how you can add aggregates in the “Employee Sales by Country” sample:
Employee Sales by Country Code
var date1 = new DateTime(2015, 9, 7, 0, 0, 0);
var date2 = new DateTime(2016, 5, 5, 0, 0, 0);
var dsSales = new DataSet(dataSource, string.Format(
"SELECT o.ShipCountry, e.EmployeeID, e.FirstName, e.LastName, o.ShippedDate, o.Freight " +
"FROM Employees e, Orders o " +
"WHERE e.EmployeeID = o.EmployeeID AND o.ShippedDate IS NOT NULL AND o.ShippedDate BETWEEN #{0} 00:00:00# AND #{1} 00:00:00# " +
"ORDER BY o.ShipCountry, e.FirstName, e.LastName, o.ShippedDate", date1.ToString(@"MM\/dd\/yyyy"), date2.ToString(@"MM\/dd\/yyyy")));
_printDocument.DataSchema.DataSources.Add(dataSource);
_printDocument.DataSchema.DataSets.Add(dsSales);
var raCaption = new RenderArea();
var header1 = new RenderText();
header1.Text = "Employee sales by country";
var header2 = new RenderText();
header2.Text = string.Format("Between {0} and {1}", date1.ToShortDateString(), date2.ToShortDateString());
raCaption.Children.Add(header1);
raCaption.Children.Add(header2);
_printDocument.Body.Children.Add(raCaption);
var rt = new RenderTable();
rt.Cells[0, 0].Text = "[Fields!ShipCountry.Value]";
rt.Cells[0, 2].Text = "$[Aggregates!SumByCountry.Value]";
rt.Cells[1, 0].Text = "[Fields!FirstName.Value] [Fields!LastName.Value]";
rt.Cells[1, 1].Text = "[Math.Round(Aggregates!SumByEmployee.Value / Aggregates!SumByCountry.Value * 100, 1)]%";
rt.Cells[1, 2].Text = "$[Aggregates!SumByEmployee.Value]";
TableVectorGroup tvg = rt.RowGroups[0, 2];
tvg.DataBinding.DataSource = dsSales;
tvg.DataBinding.Grouping.Expressions.Add("Fields!ShipCountry.Value");
_printDocument.DataSchema.Aggregates.Add(new Aggregate("SumByCountry", "Fields!Freight.Value", tvg.DataBinding, RunningEnum.Group, AggregateFuncEnum.Sum));
tvg = rt.RowGroups[1, 1];
tvg.DataBinding.DataSource = dsSales;
tvg.DataBinding.Grouping.Expressions.Add("Fields!EmployeeID.Value");
_printDocument.DataSchema.Aggregates.Add(new Aggregate("SumByEmployee", "Fields!Freight.Value", tvg.DataBinding, RunningEnum.Group, AggregateFuncEnum.Sum));
tvg = rt.RowGroups[1, 1];
tvg.DataBinding.DataSource = dsSales;
_printDocument.Body.Children.Add(rt);
_printDocument.Generate();
In the above code, the aggregate is constructed with this method call: new Aggregate(“SumByCountry”, “Fields!Freight.Value”, tvg.DataBinding, RunningEnum.Group, AggregateFuncEnum.Sum). Parameters are:
- “SumByCountry” is the aggregate name.
- “Fields!Freight.Value” is the expression for calculating the sum.
- “tvg.DataBinding” is the data source for the aggregate.
- “RunningEnum.Group” means that the aggregate has a group scope.
- “AggregateFuncEnum.Sum” means the aggregate returns the sum of values of the expression within the scope.
The C1PrintDocument.DataSchema.Aggregates.Add method adds Aggregate object to Aggregates collection. Then, the aggregate with “SumByCountry” name can be used in any place of document like this: rt.Cells[0, 2].Text = “$[Aggregates!SumByCountry.Value]”.
Adding aggregate to document.Aggregates collection is not obligatory. You can use aggregate functions directly in any expression, as shown here.
Drawing the Charts
Very often, people want to see a visual representation of their data. The “Sales by Category” sample generates charts using FlexChart control and then inserts images into the document.
Here is how it looks when previewed:
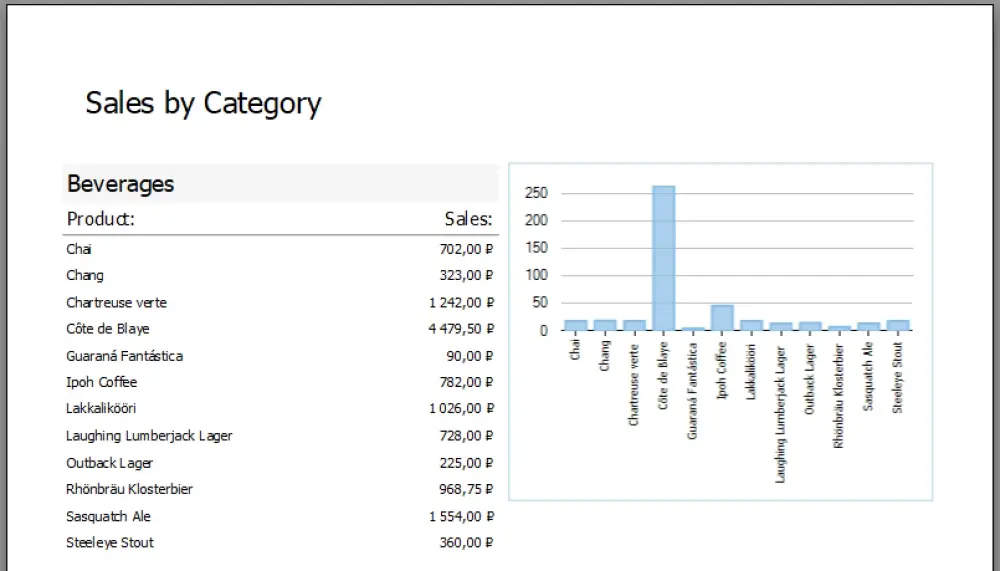
To use some arbitrary assembly in the C1PrintDocument scripts, it should be added to the C1PrintDocument.ScriptingOptions.ExternalAssemblies collection. To use FlexChart, we should add references to FlexChart and its dependencies.
Sales by Category Code
_printDocument.ScriptingOptions.ExternalAssemblies.Add(typeof(Form).Assembly.ManifestModule.Name);
_printDocument.ScriptingOptions.ExternalAssemblies.Add(typeof(C1.Win.Chart.FlexChart).Assembly.ManifestModule.Name);
_printDocument.ScriptingOptions.ExternalAssemblies.Add("System.Data.dll");
_printDocument.ScriptingOptions.ExternalAssemblies.Add("System.Xml.dll");
Tag newTag = new Tag("dataTable", GetDataSource(), typeof(System.Data.DataTable));
_printDocument.Tags.Add(newTag);
var dataSource = CreateDemoDataSource();
var dsCategories = new DataSet(dataSource,
"SELECT c.CategoryName, p.ProductName, p.UnitPrice, p.UnitsInStock " +
"FROM Products p, Categories c " +
"WHERE p.CategoryID = c.CategoryID " +
"ORDER BY c.CategoryName, p.ProductName");
_printDocument.DataSchema.DataSources.Add(dataSource);
_printDocument.DataSchema.DataSets.Add(dsCategories);
var rt = new RenderTable();
rt.Cells[1, 0].Text = "[Fields!CategoryName.Value]";
rt.Cells[2, 0].Text = "Product:";
rt.Cells[2, 1].Text = "Sales:";
rt.Cells[3, 0].Text = "[Fields!ProductName.Value]";
rt.Cells[3, 1].Text = "[string.Format(\"{0:C}\",Fields!UnitPrice.Value * Fields!UnitsInStock.Value)]";
TableVectorGroup tvg = rt.RowGroups[0, 4];
tvg.DataBinding.DataSource = dsCategories;
tvg.DataBinding.Grouping.Expressions.Add("Fields!CategoryName.Value");
tvg = rt.RowGroups[3, 1];
tvg.DataBinding.DataSource = dsCategories;
var raLeft = new RenderArea();
raLeft.Children.Add(rt);
RenderArea raContainer = new RenderArea();
raContainer.Stacking = StackingRulesEnum.InlineLeftToRight;
raContainer.SplitVertBehavior = SplitBehaviorEnum.SplitIfLarge;
raContainer.DataBinding.DataSource = dsCategories;
raContainer.DataBinding.Grouping.Expressions.Add("Fields!CategoryName.Value");
RenderImage ri = new RenderImage(_printDocument);
_printDocument.ThrowExceptionOnError = true;
_printDocument.AddWarningsWhenErrorInScript = true;
ri.FormatDataBindingInstanceScript = @"! see VB script below !";
RenderArea raRight = new RenderArea();
raRight.Children.Add(ri);
raContainer.Children.Add(raLeft);
raContainer.Children.Add(raRight);
_printDocument.Body.Children.Add(raContainer);
_printDocument.Generate();
The Visual Basic script (used in FormatDataBindingInstanceScript in the above code) creates a chart object, assigns a data source to it, and then converts the chart to an image:
Visual Basic Script to Create the Chart
Dim chart as C1.Win.Chart.FlexChart = New C1.Win.Chart.FlexChart()
chart.BindingX = ""ProductName""
chart.Binding = ""UnitPrice""
chart.BindingContext = New System.Windows.Forms.BindingContext()
chart.AxisX.Style.Font = new System.Drawing.Font(""Tahoma"", 7, System.Drawing.FontStyle.Regular)
chart.ChartType = C1.Chart.ChartType.Column
chart.BackColor = Color.White
chart.AxisX.OverlappingLabels = C1.Chart.OverlappingLabels.Auto
chart.AxisX.LabelAngle = 90
Dim series = new C1.Win.Chart.Series()
chart.Series.Add(series)
Dim size as Size = New Size(340, 270)
Dim documentTag = DirectCast(Document.Tags, TagCollection)
Dim dt = DirectCast(documentTag!dataTable.Value, System.Data.DataTable)
Dim dv as System.Data.DataView = New System.Data.DataView(dt)
Dim filter as String = ""CategoryName = "" & RenderObject.Original.Parent.DataBinding.Parent.Fields!CategoryName.Value & ""
dv.RowFilter = filter
chart.DataSource = dv
Dim ms as IO.MemoryStream = New IO.MemoryStream()
chart.SaveImage(ms, C1.Win.Chart.ImageFormat.Png, size.Width, size.Height)
Dim ri as RenderImage = DirectCast(RenderObject, RenderImage)
ri.Image = Image.FromStream(ms)
Similarly, you can add your custom assemblies to references and use your classes in document scripts.
The structure of the C1PrintDocument is hierarchical and relatively simple. The data is set using bindings and displaying in groups that define the appearance of data.
Each element inherited from RenderObject supports the execution of scripts that extend the functionality. It’s a great tool to create simple reports or print some unbound text with different layout options.
We will continue supporting C1PrintDocument in the .NET 4.5.2 version and in .NET 5, .NET 6, and beyond.
Get the complete sample code.