Today we will see, how to enable Logging directly to Loki via Serilog for a .NET Core Microservice and visualize the logs in Grafana.

Before we start,
Loki is a horizontally scalable, highly available, multi-tenant log aggregation system inspired by Prometheus. It is designed to be very cost effective and easy to operate. It does not index the contents of the logs, but rather a set of labels for each log stream.
The Loki project was started at Grafana Labs in 2018, and announced at KubeCon Seattle. Loki is released under the AGPLv3 license.
Grafana Labs is proud to lead the development of the Loki project, building first-class support for Loki into Grafana, and ensuring Grafana Labs customers receive Loki support and features they need.
Grafana open source is open source visualization and analytics software. It allows you to query, visualize, alert on, and explore your metrics, logs, and traces no matter where they are stored. It provides you with tools to turn your time-series database (TSDB) data into insightful graphs and visualizations.
Serilog provides diagnostic logging to files, the console, and elsewhere. It is easy to set up, has a clean API, and is portable between recent .NET platforms.
Unlike other logging libraries, Serilog is built with powerful structured event data in mind. This is a library, we are going to use to export our logs to Loki.
• • •
Things we need to get started,
- Visual Studio 2022.
- Docker Desktop.
We are going to use Visual Studio 2022 to create a small Restful Microservice and will implement Serilog logging and format the logs and send it to Loki and then we will visualize the logs in Grafana.
Let’s get started,
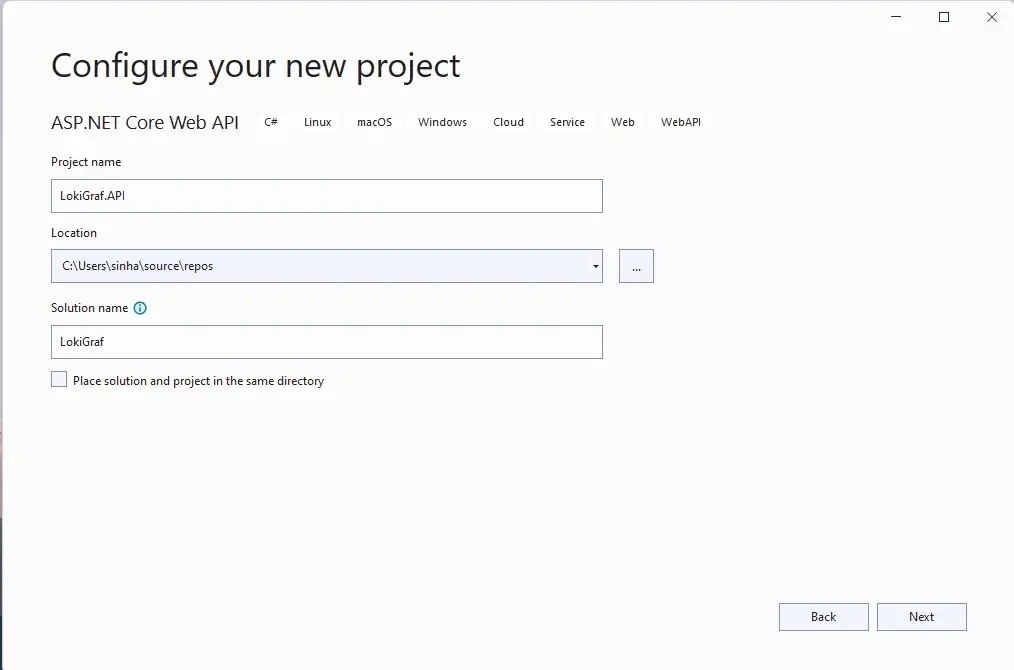
1. Open Visual Studio, Create a new project, select ASP.NET Core Web API template, click on Next, Provide a Name for your Project and Solution.
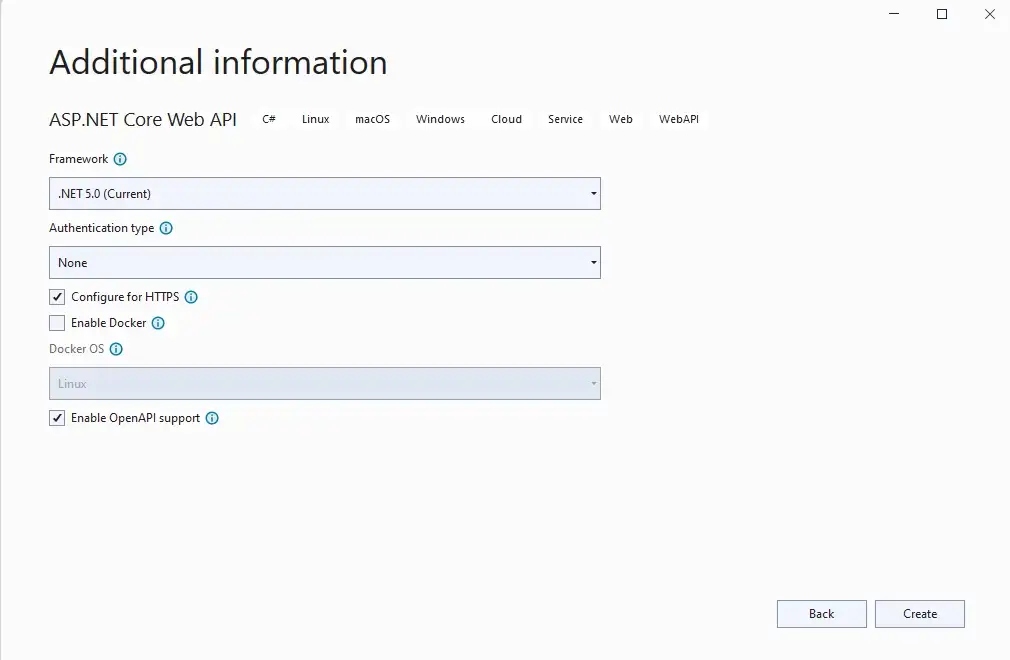
Click on Next, Choose Framework as .NET 5.0 , Authentication type as None, Checked Configure for HTTPS, and also Enable Open API support. We will add the docker support later and Click on Create.
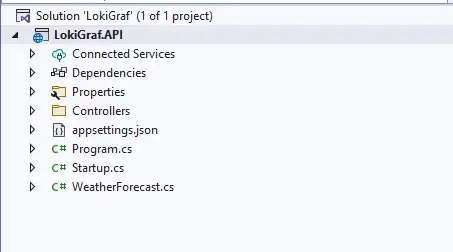
It will create a default Weather Forecast API.
2. Now our Project is Created, we need to few Serilog libraries to get installed. To do that, let’s open the project in Terminal and run below commands,
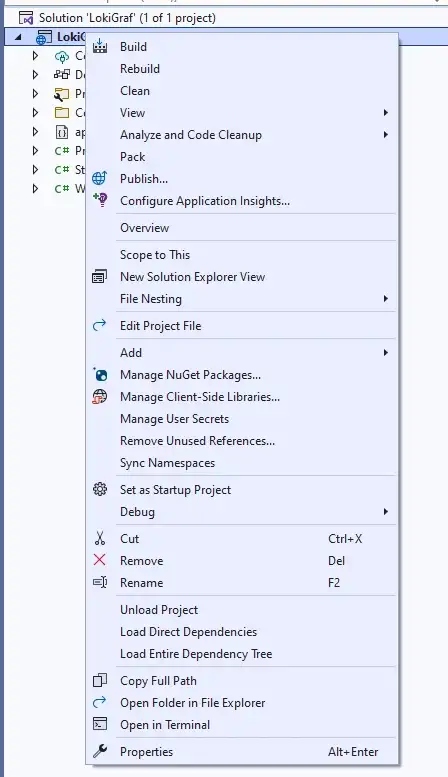
Open in Terminal Option
dotnet add package Serilog.AspNetCore

dotnet add package Serilog.Sinks.Grafana.Loki
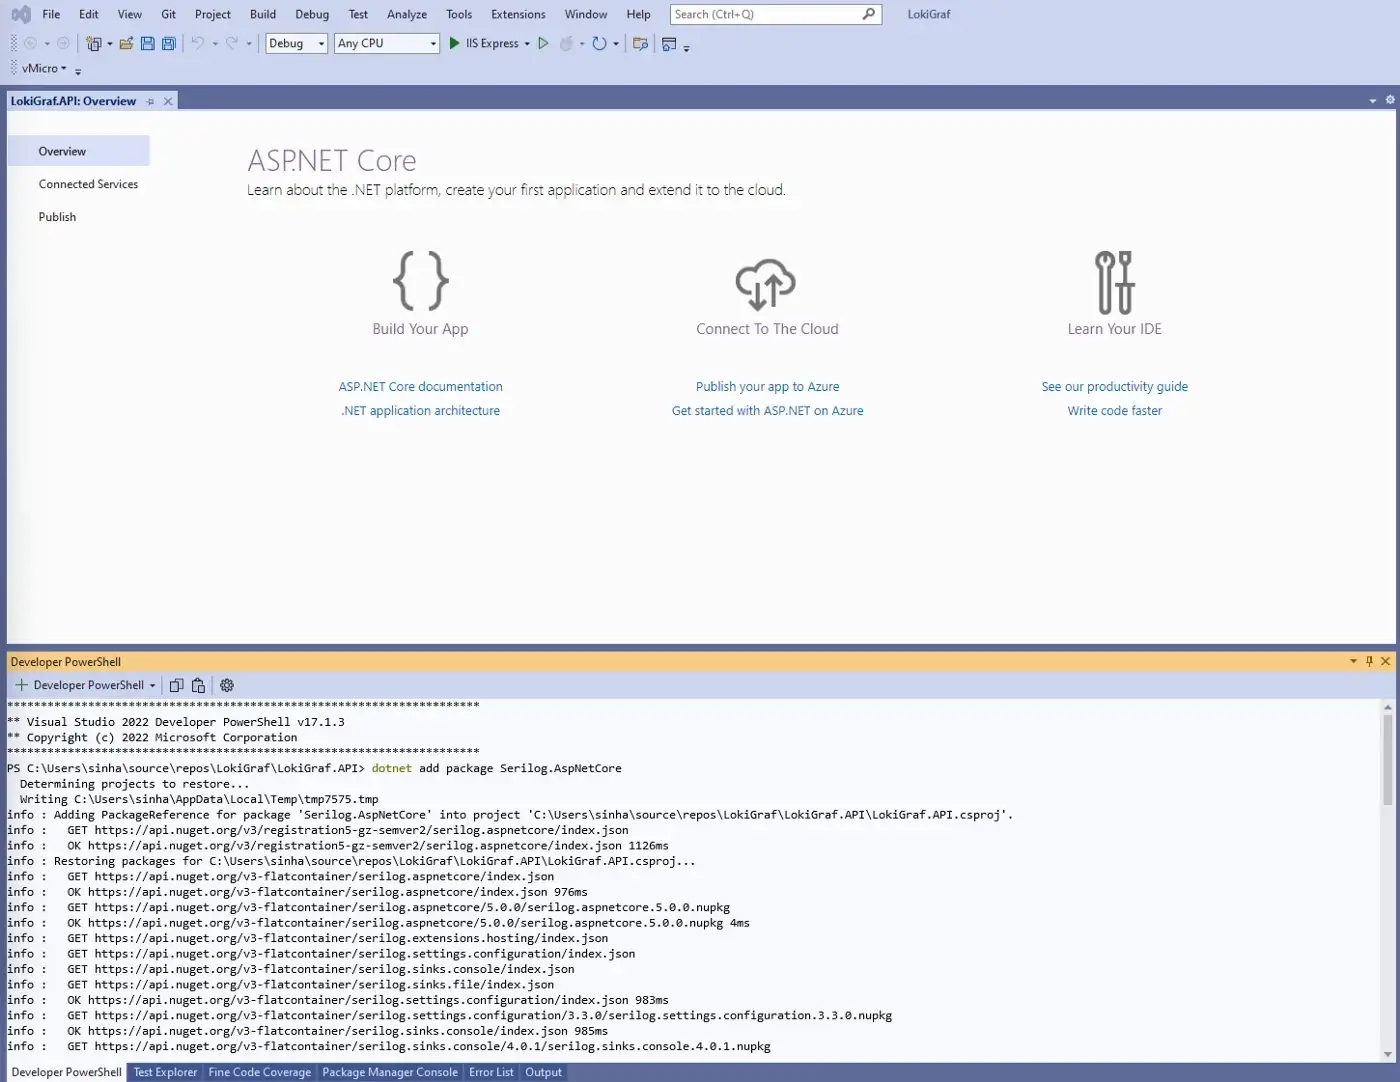
This will install these two libraries, you can do it via Nuget Package Manager as well
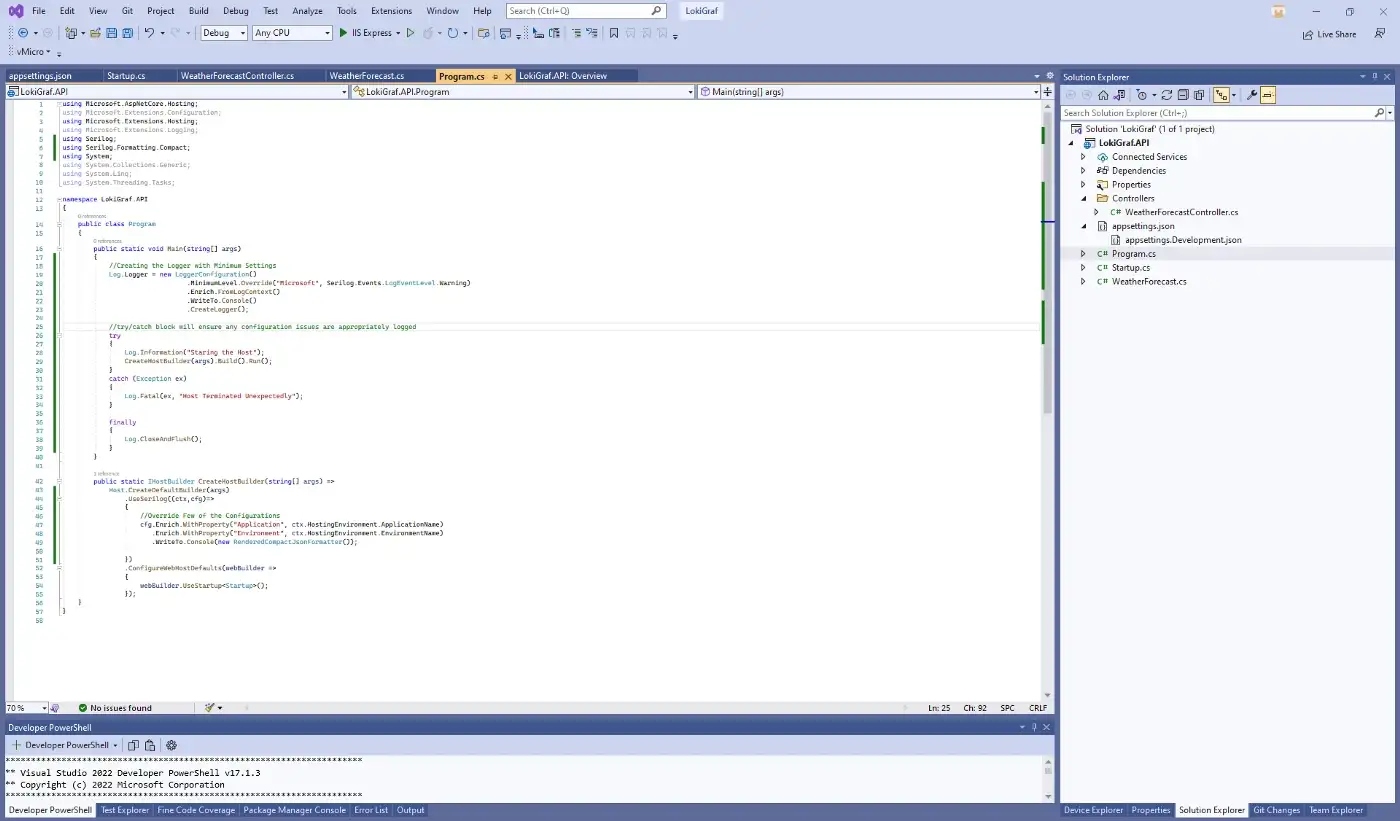
3. Let’s configure Logging, in our application, open Program.cs, and make following change,
using Microsoft.AspNetCore.Hosting;

using Microsoft.Extensions.Configuration;

using Microsoft.Extensions.Hosting;

using Microsoft.Extensions.Logging;

using Serilog;

using Serilog.Formatting.Compact;

using System;

using System.Collections.Generic;

using System.Linq;

using System.Threading.Tasks;


namespace LokiGraf.API

{

    public class Program

    {

        public static void Main(string[] args)

        {

            //Creating the Logger with Minimum Settings

            Log.Logger = new LoggerConfiguration()

                                .MinimumLevel.Override("Microsoft", Serilog.Events.LogEventLevel.Warning)

                                .Enrich.FromLogContext()

                                .WriteTo.Console()

                                .CreateLogger();


            //try/catch block will ensure any configuration issues are appropriately logged

            try

            {

                Log.Information("Staring the Host");

                CreateHostBuilder(args).Build().Run();

            }

            catch (Exception ex)

            {

                Log.Fatal(ex, "Host Terminated Unexpectedly");

            }


            finally

            {

                Log.CloseAndFlush();

            }

        }


        public static IHostBuilder CreateHostBuilder(string[] args) =>

            Host.CreateDefaultBuilder(args)

                .UseSerilog((ctx,cfg)=>

                {

                    //Override Few of the Configurations

                    cfg.Enrich.WithProperty("Application", ctx.HostingEnvironment.ApplicationName)

                       .Enrich.WithProperty("Environment", ctx.HostingEnvironment.EnvironmentName)

                       .WriteTo.Console(new RenderedCompactJsonFormatter());


                })

                .ConfigureWebHostDefaults(webBuilder =>

                {

                    webBuilder.UseStartup<Startup>();

                });

    }

}
Now we will remove, extra logging configurations from appsettings.json and appsettings.Development.json as we are currently maintaining the configuration from code.
We need to remove Logging section in both the files.
"Logging": {

  "LogLevel": {

    "Default": "Information",

    "Microsoft": "Warning",

    "Microsoft.Hosting.Lifetime": "Information"

  }

}
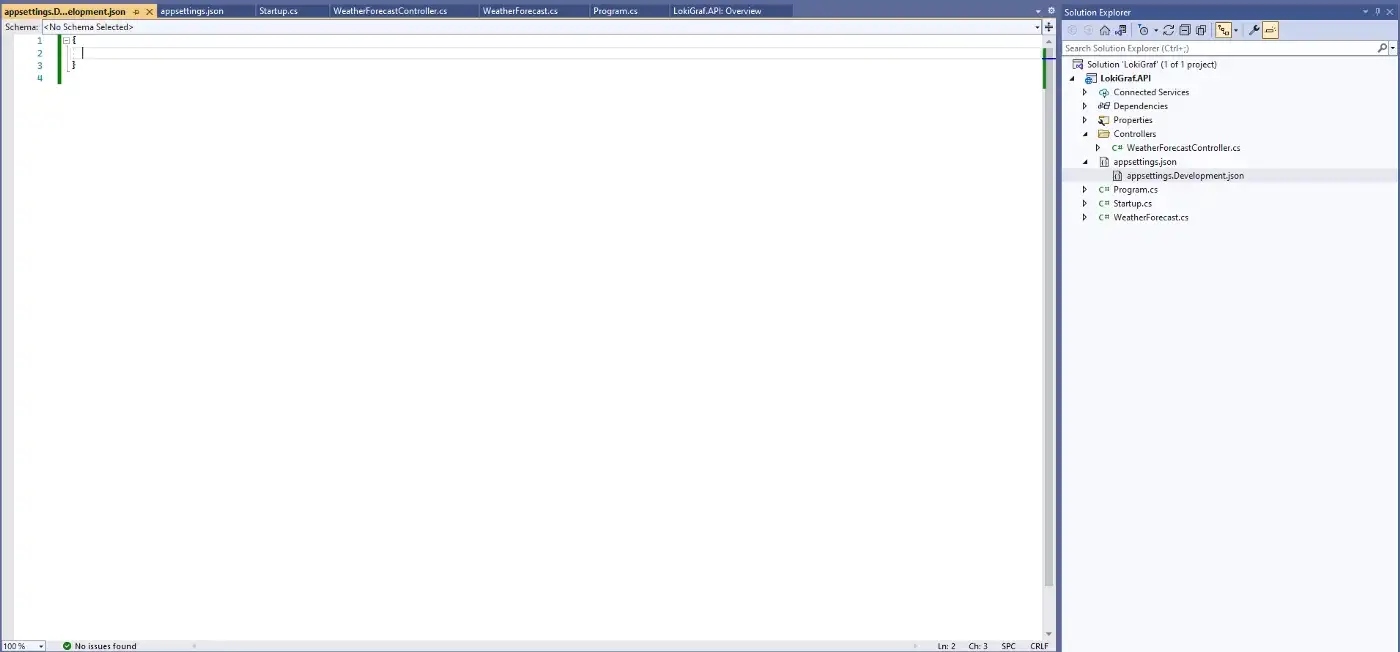
appsettings.Development.json
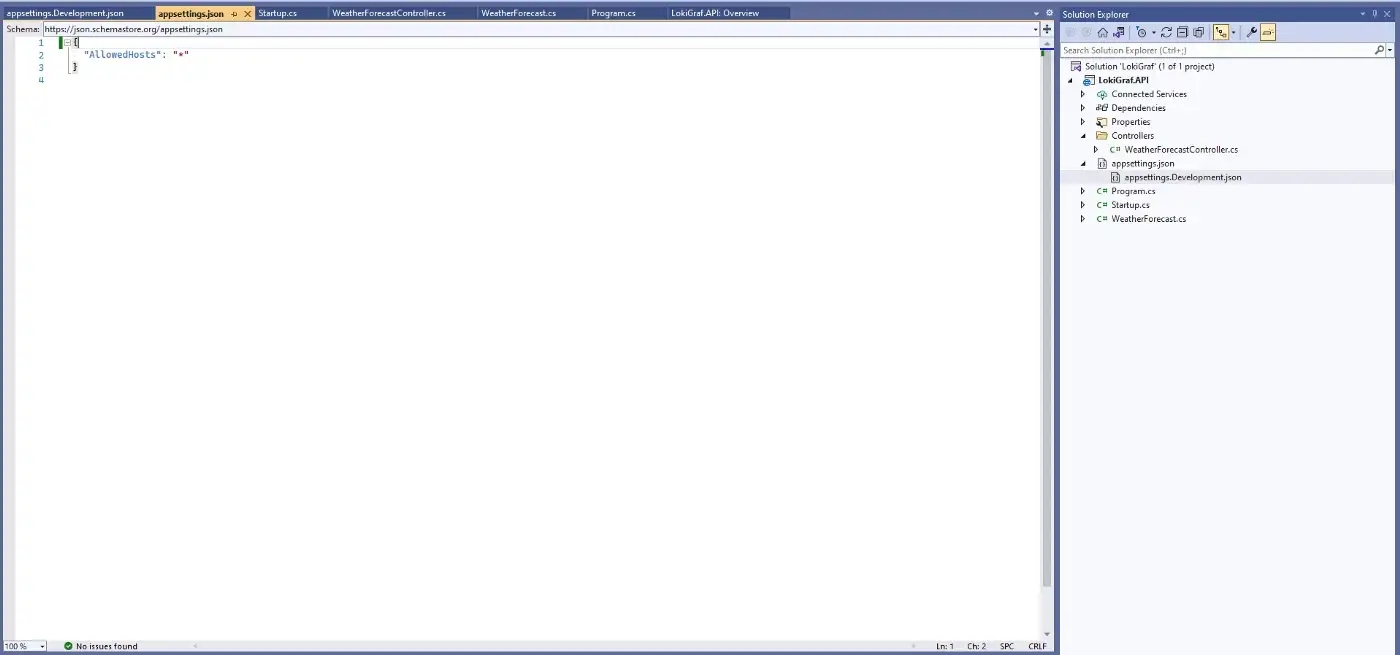
appsettings.json
Now we will enable Serilog Request Logging feature by adding a single line in Startup.cs
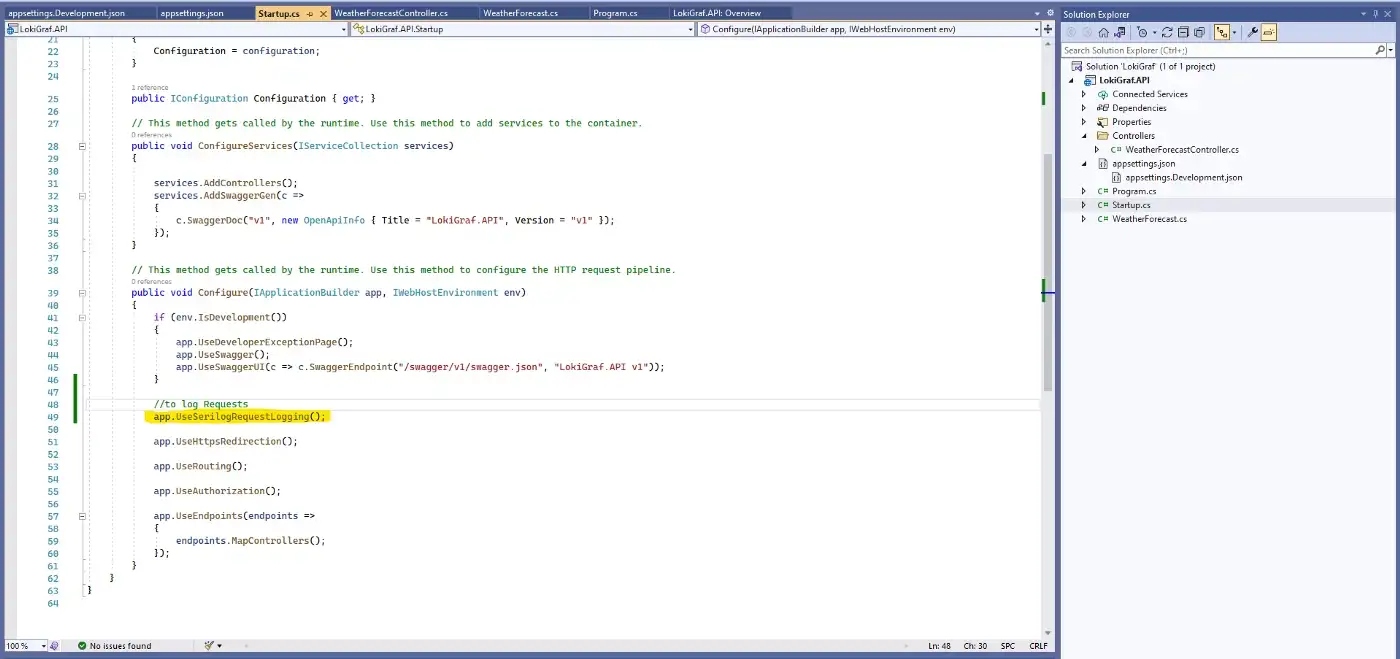
Startup.cs (Configure method)
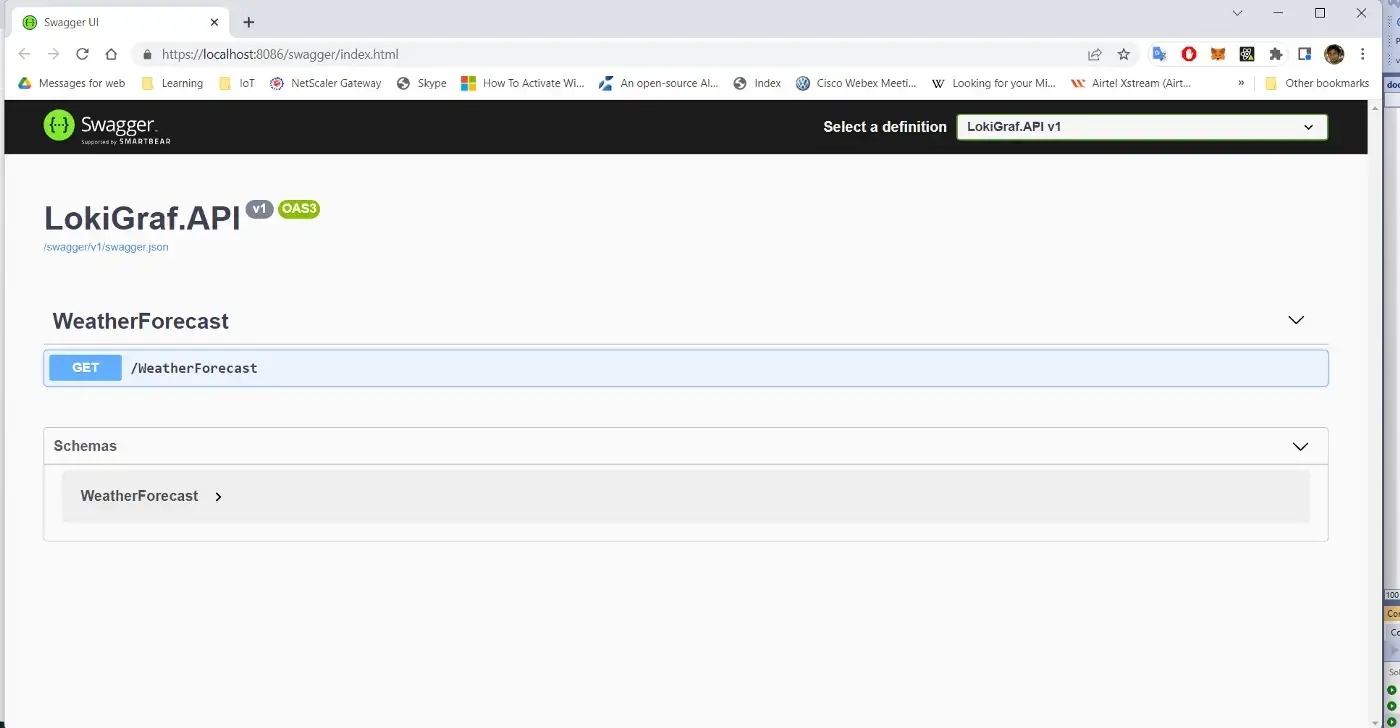
4. Let’s run the application, see the logs in console,
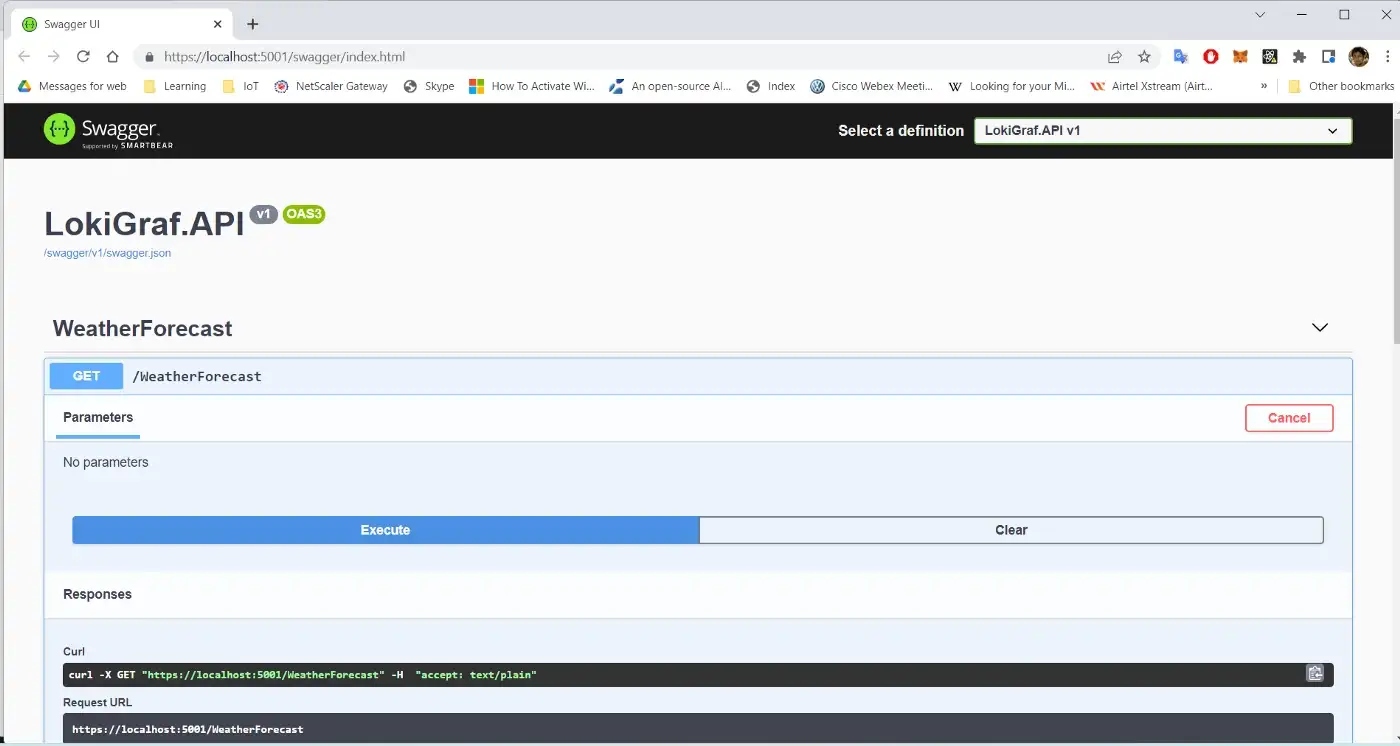
Swagger UI , Test the API
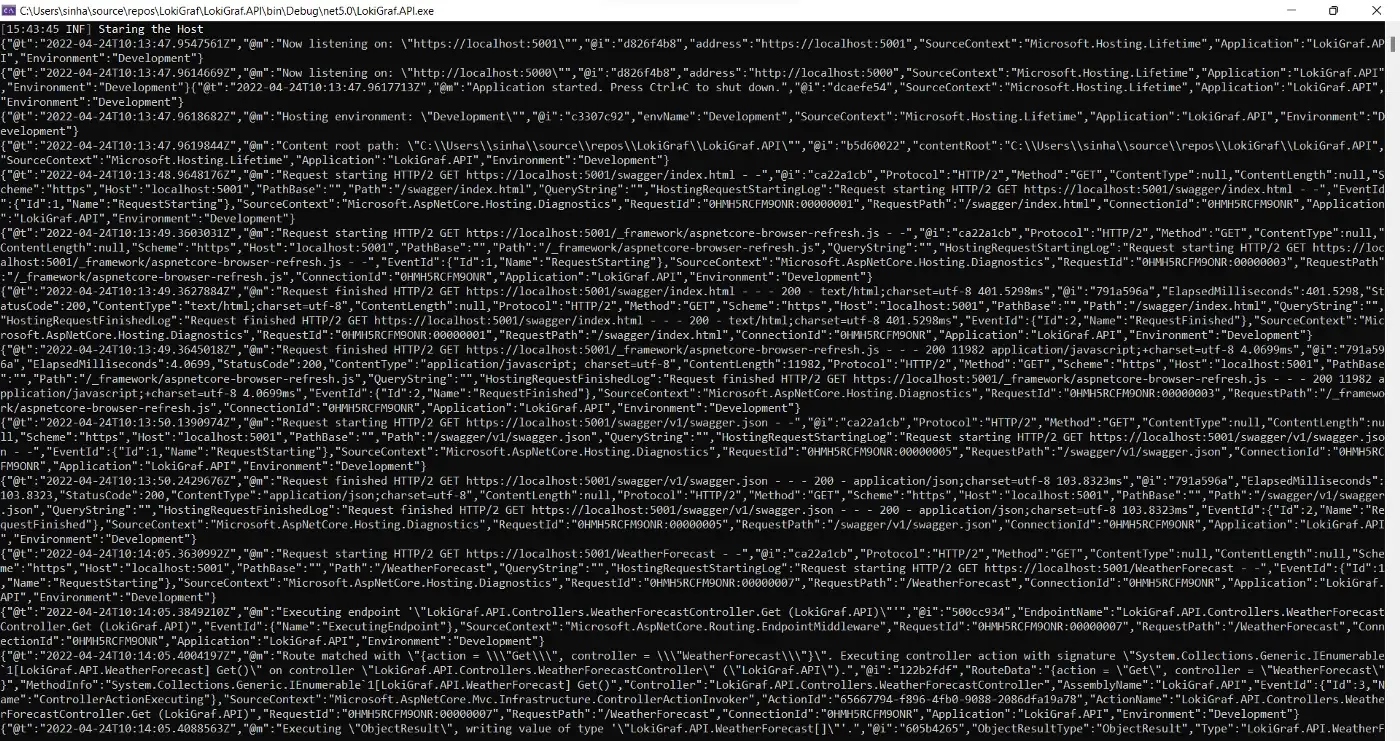
Logs have been written in JSON format
So our Application is working, you can see that first log is written in normal format and once we override our settings all the logs are getting written in JSON format.
5. Now, our Logging mechanism is up and running, we will add docker support and docker compose for our application. To add Docker support for our project, right click on the project, and then add and then select docker support,
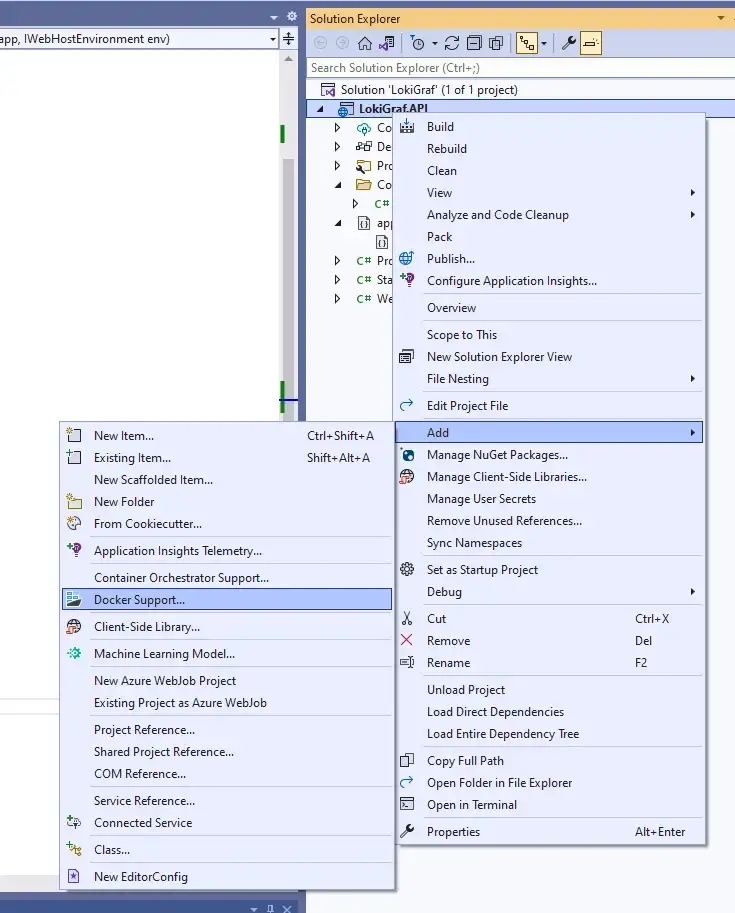
Add Docker Support
It will ask for Target OS, I prefer Linux.
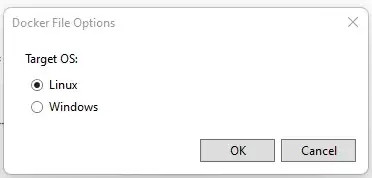
Target OS
Once, we click on Ok it will create a Dockerfile in the root directory of the project.
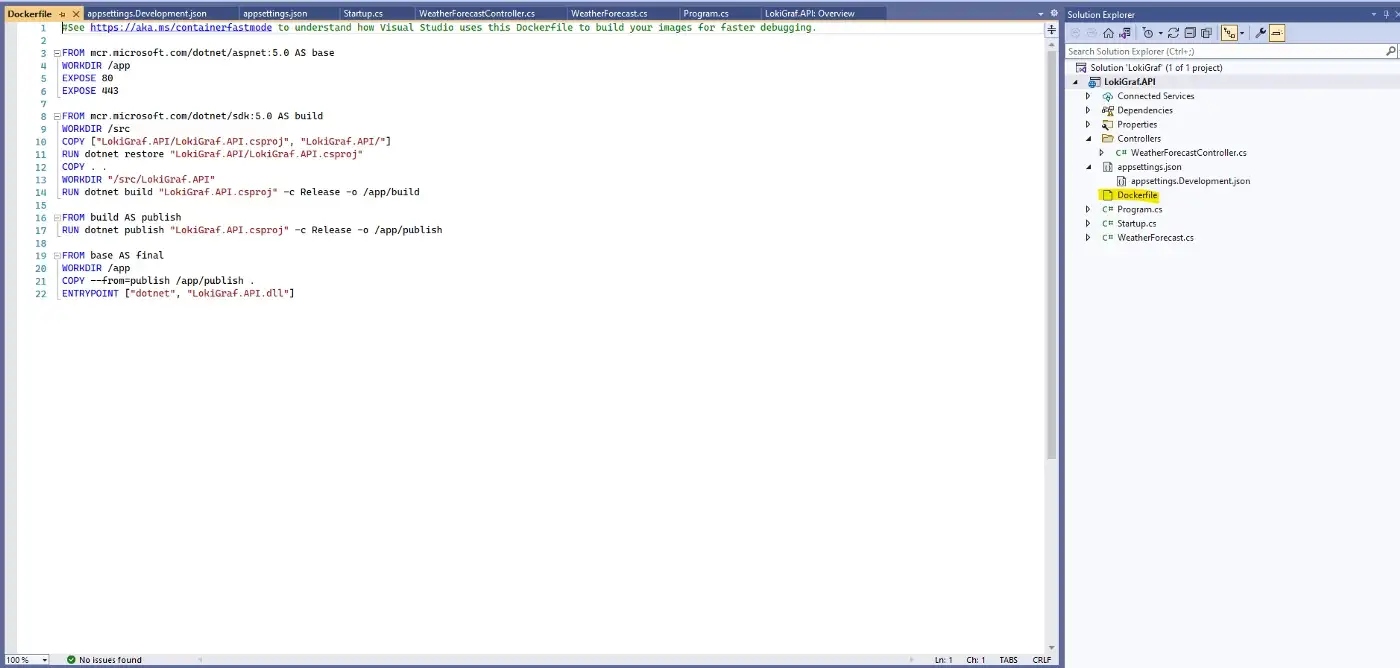
Dockerfile contains instruction to create Image
Now, right click on the Project, add, and then select Container Orchestration Support,
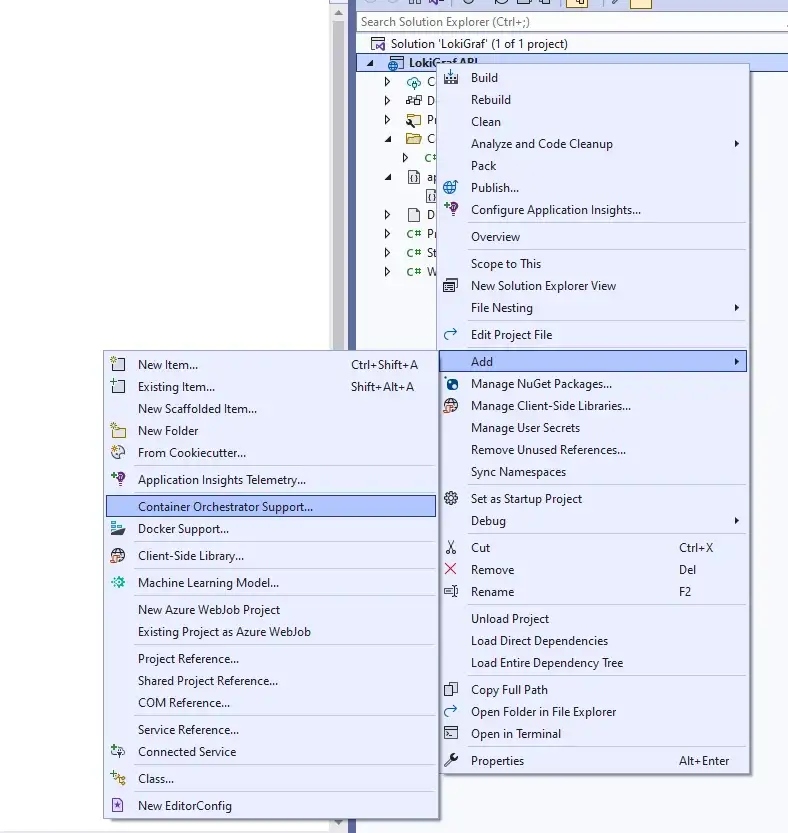
Container Orchestration Support
Then choose Container Orchestrator as Docker Compose,
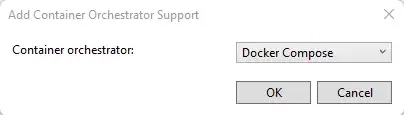
Then again choose Target OS, I will be choosing Linux, as I have also choosed Linux earlier and I prefer it this way,
Target OS
It will add a new docker compose project,
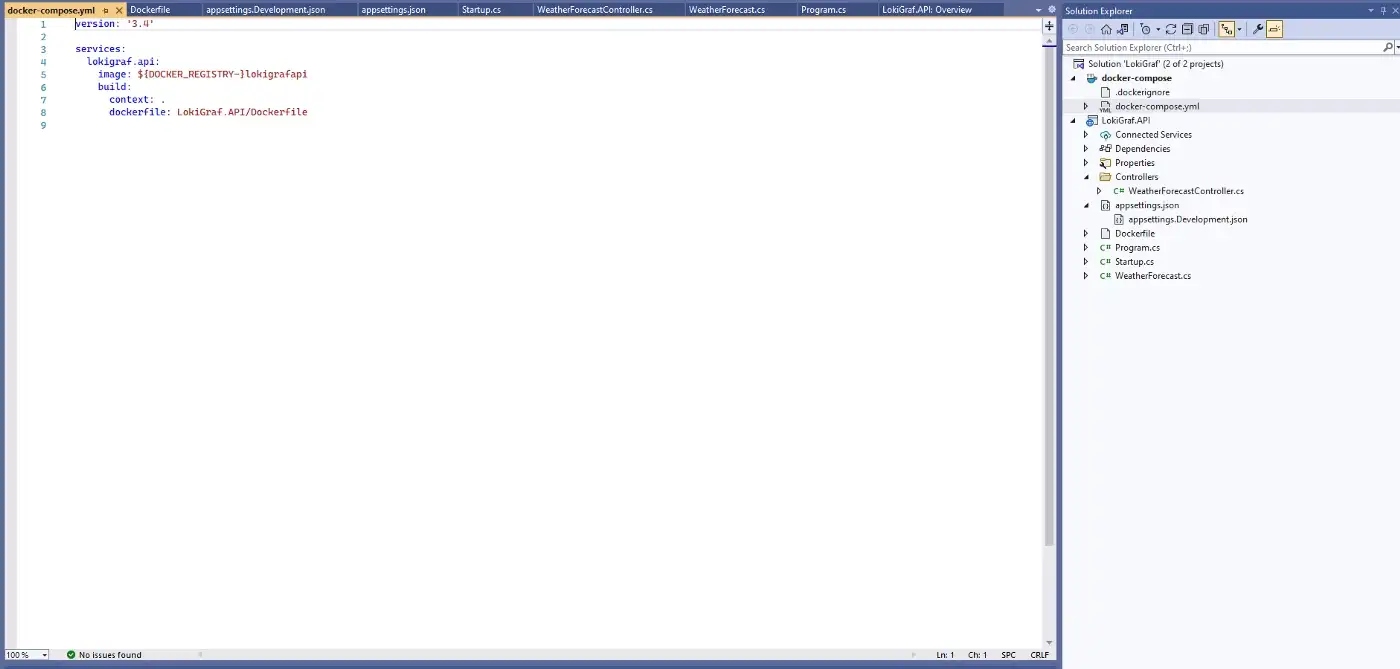
docker-compose project
6. Now we will modify our docker compose file to create Grafana and Loki instances and will also add Health Conditions for them. For us, Loki needs to be healthy before our application is up and running, so that it can receives the logs. Please remove docker-compose.override.yml file. so that it will not override any of our settings.
If you want you can explicitly provide the container name for your API service as I have done it for Loki and Grafana container names. If we do not provide any names , it will be provided automatically.
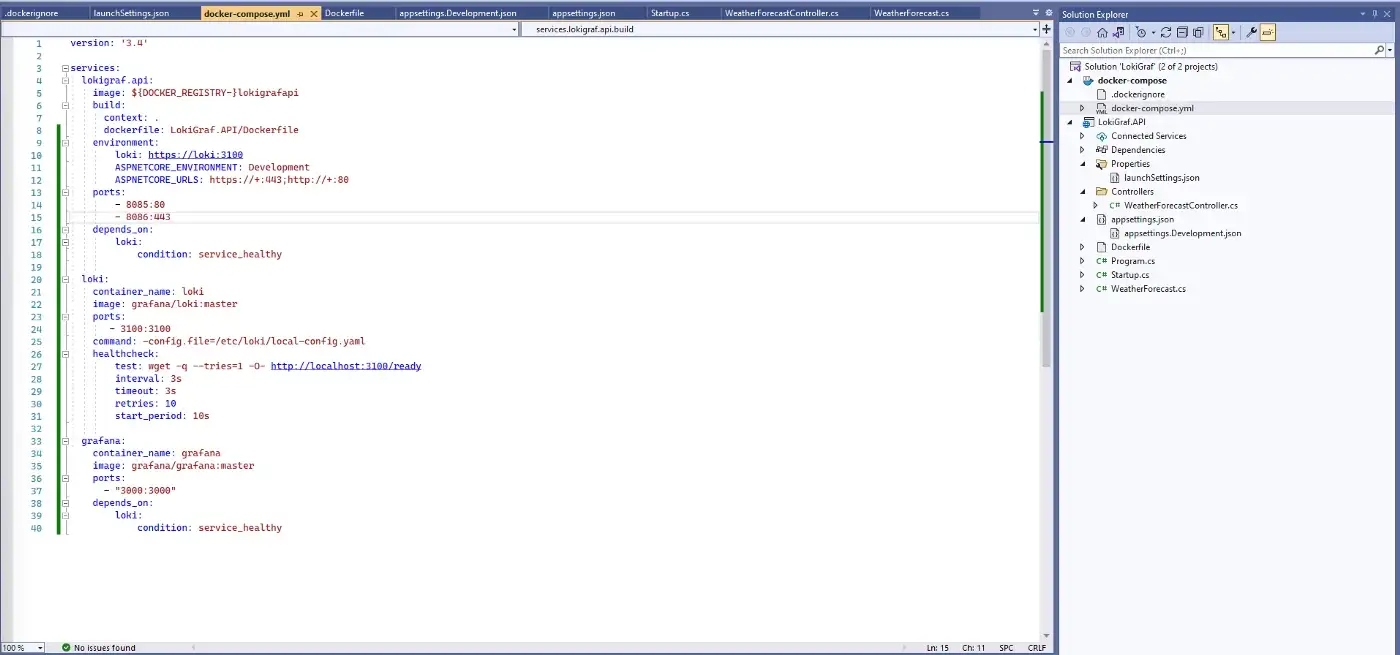
docker-compose.yml
version: '3.4'


services:

  lokigraf.api:

    image: ${DOCKER_REGISTRY-}lokigrafapi

    build:

      context: .

      dockerfile: LokiGraf.API/Dockerfile

    environment:

        loki: http://loki:3100

        ASPNETCORE_ENVIRONMENT: Development

        ASPNETCORE_URLS: https://+:443;http://+:80

    ports:

        - 8085:80

        - 8086:443

    depends_on:

        loki:

            condition: service_healthy


  loki:

    container_name: loki

    image: grafana/loki:master

    ports:

       - 3100:3100

    command: -config.file=/etc/loki/local-config.yaml

    healthcheck:

        test: wget -q --tries=1 -O- http://localhost:3100/ready

        interval: 3s

        timeout: 3s

        retries: 10

        start_period: 10s


  grafana:

    container_name: grafana

    image: grafana/grafana:master

    ports:

      - "3000:3000"

    depends_on:

        loki:

            condition: service_healthy
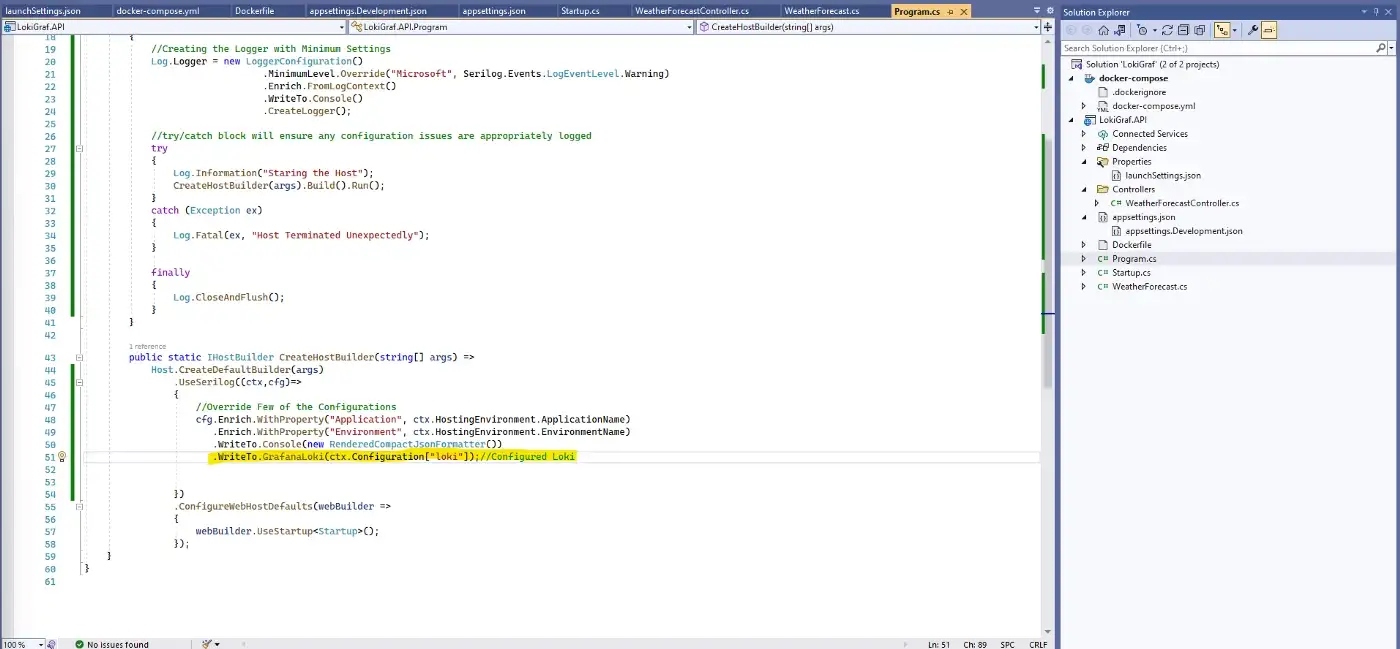
7. Now Modify our Logging configuration to include Loki Sink, let’s modify the Program.cs where we initially configured the Serilog logging, below new line will read the settings from environment variable named “loki” and send the logs to Loki instance over http.
8. Let’s run the whole application, by running Docker-Compose configuration,
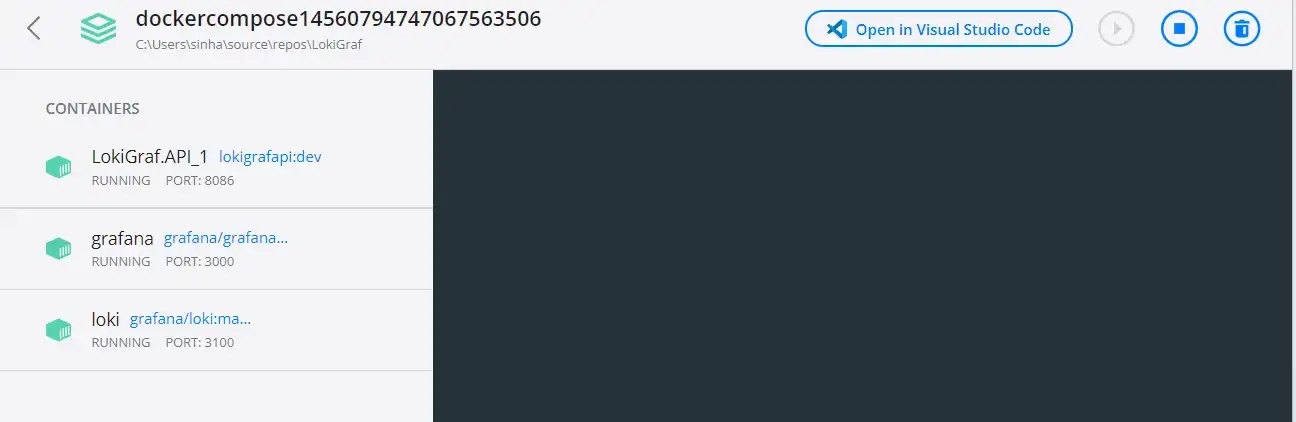
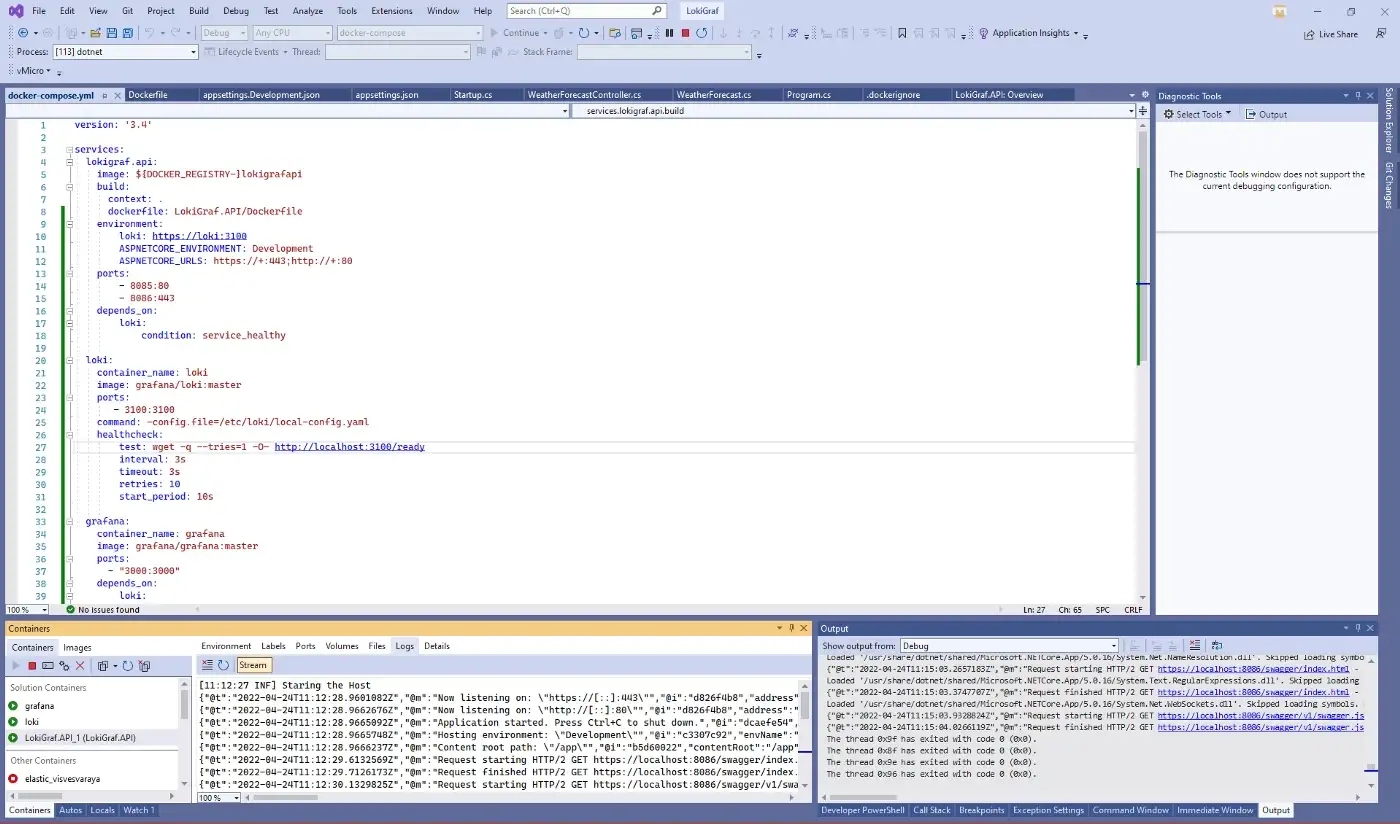
Our application is running and logging.
9. Let’s check configure our Grafana Instance, http://localhost:3000/
Default user name and password will be “admin”
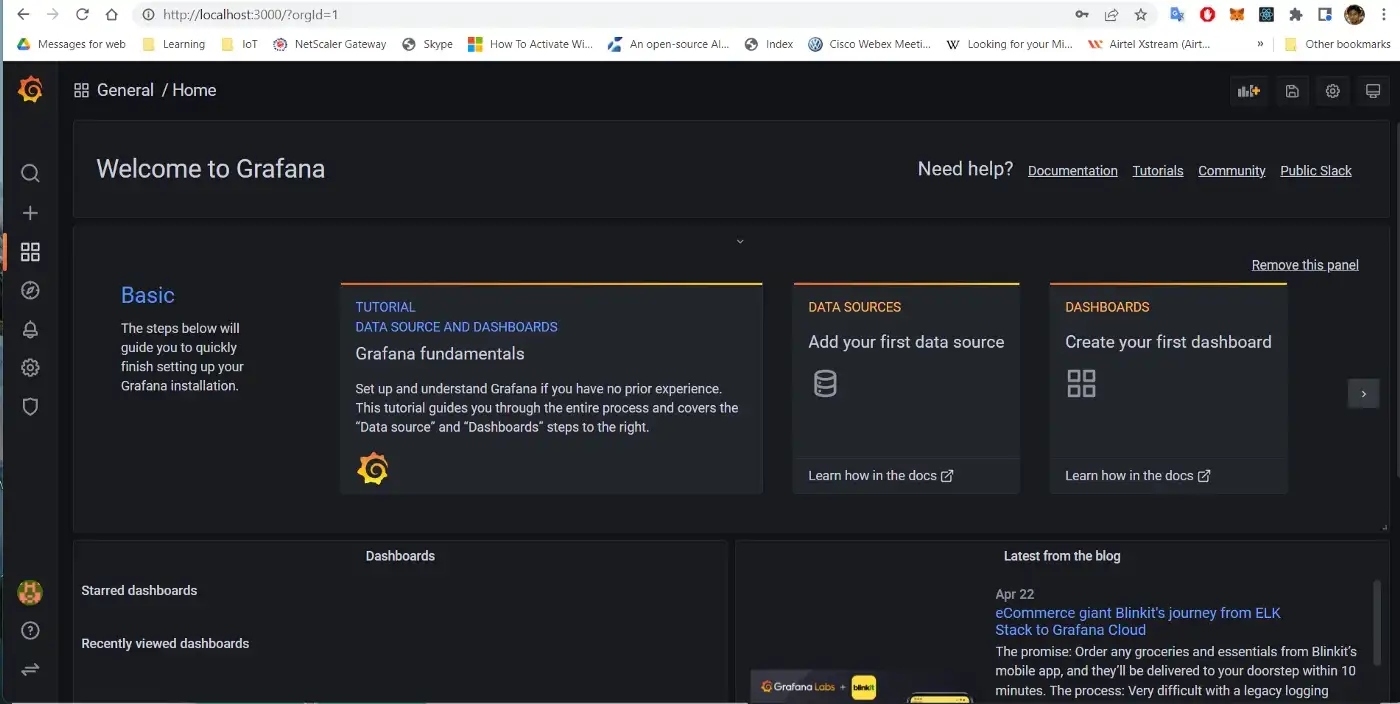
Grafana Home Page
Let’s add new Data Source Manually from the UI, if you want to populate the Data Sources and Dashboards at container creation please follow this repo’s compose file, https://github.com/arkapravasinha/GrafProm
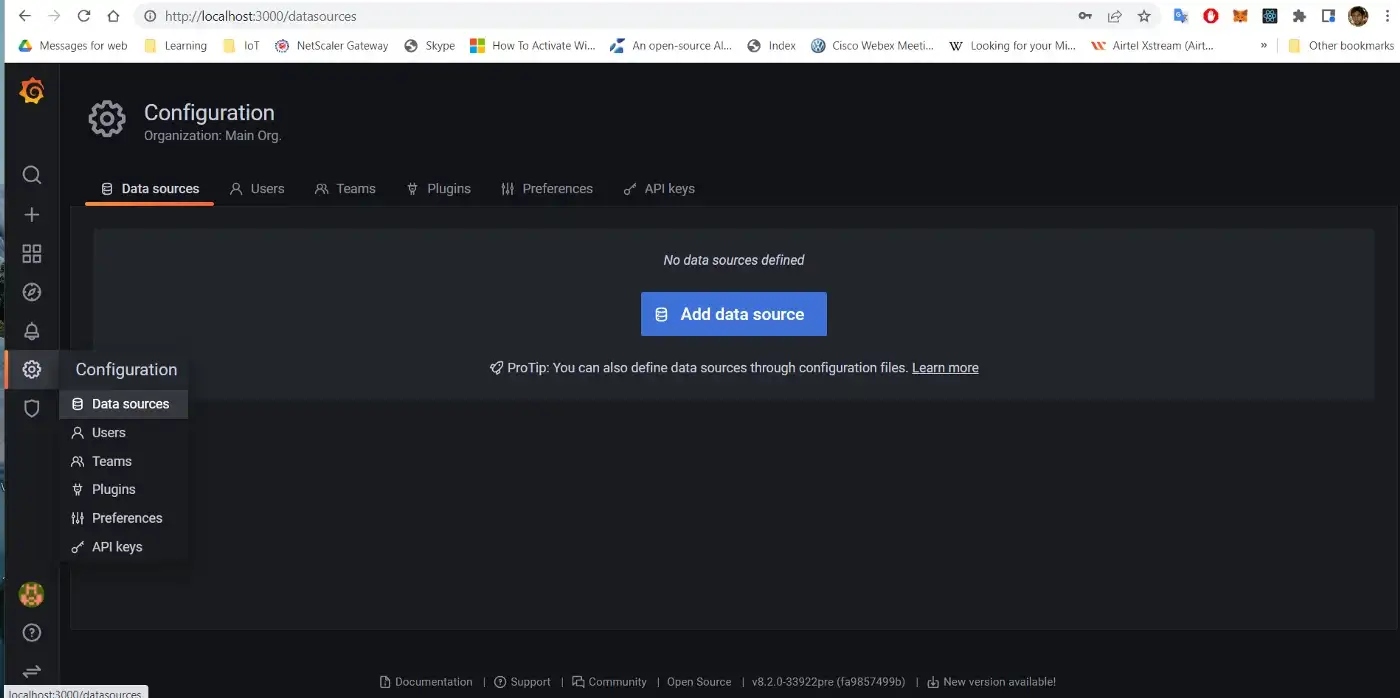
Go to Configuration-> Data Sources -> Add Data Source
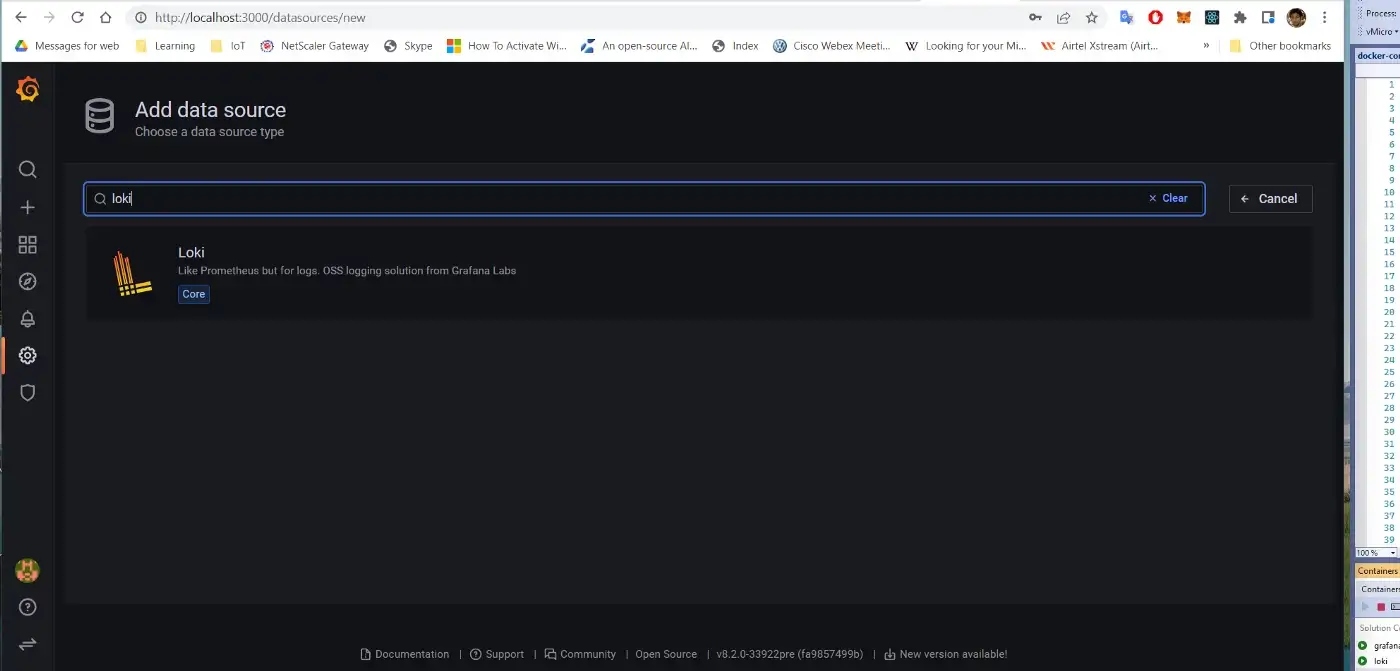
Search and Select Loki
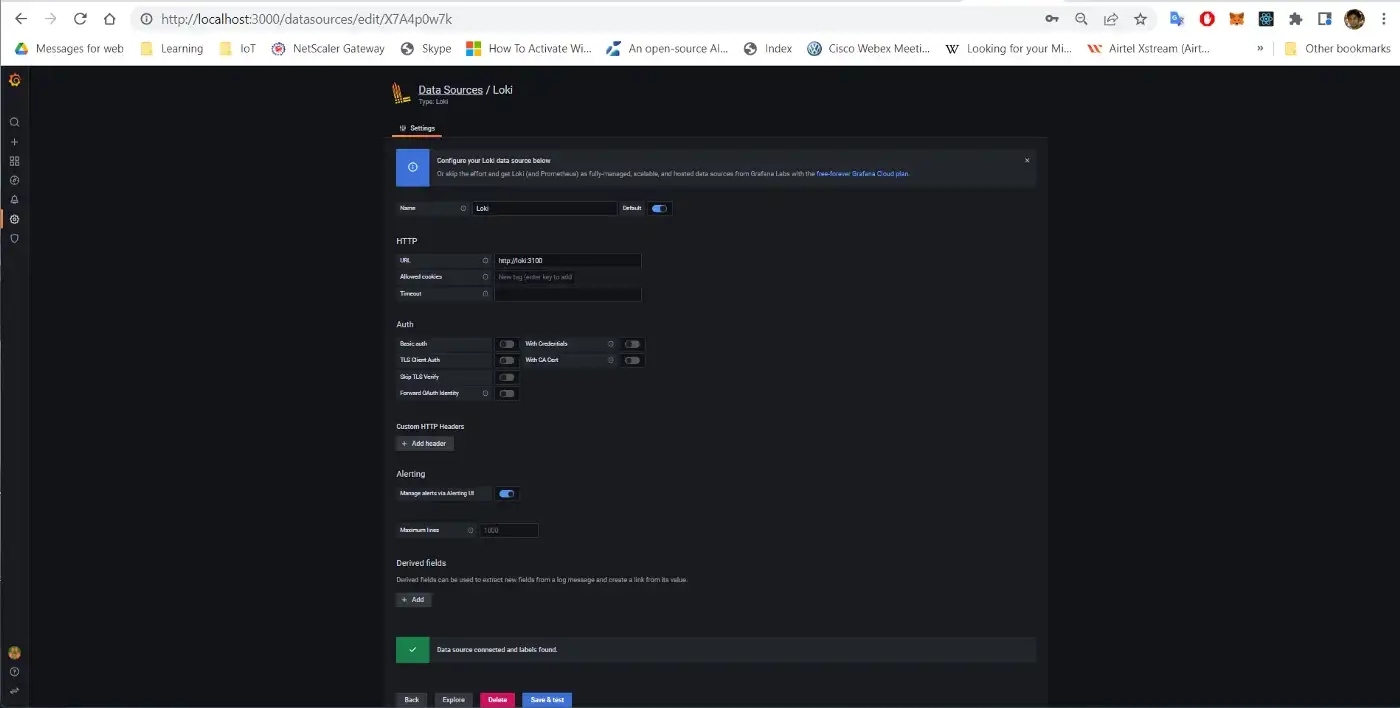
Provide Connection URL and Click on Save Test
Once Test is returned green , it means our data source is up and Running, we can now go to explore and select the source and view our logs data, first click on log Browser->Then Select Application->Then Select Our Application Name-> Then Click on Show Logs
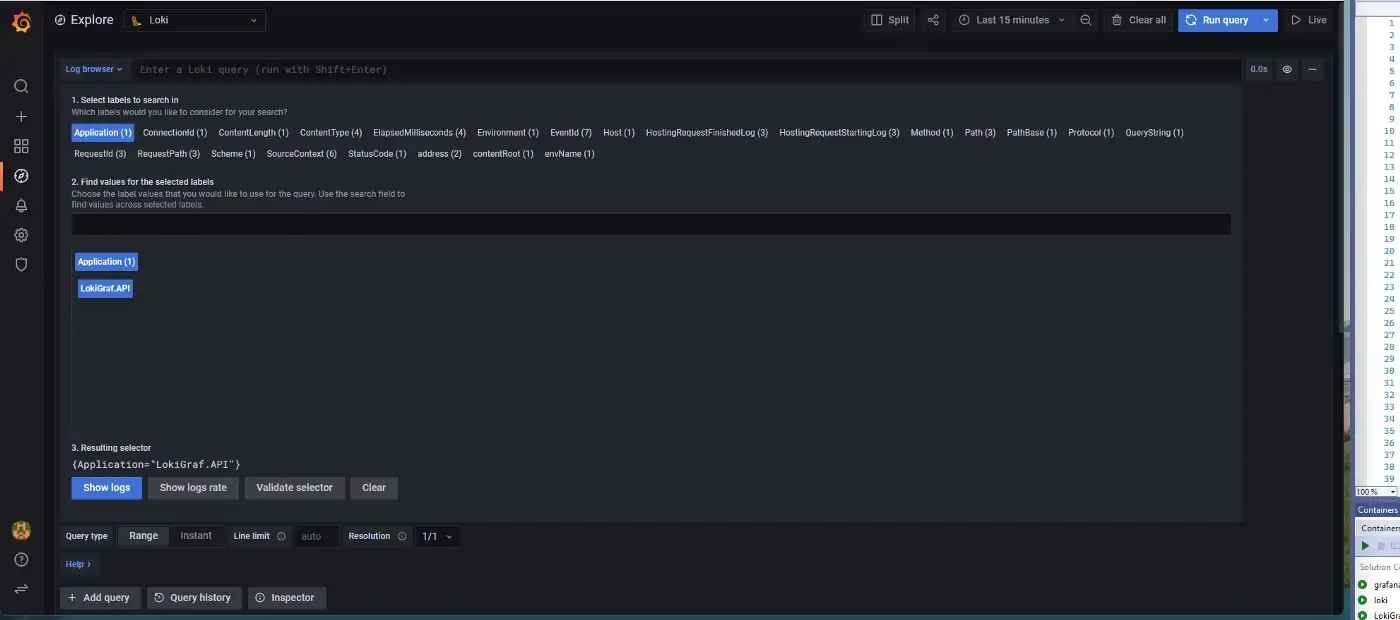
Now we can see our logs in Grafana,
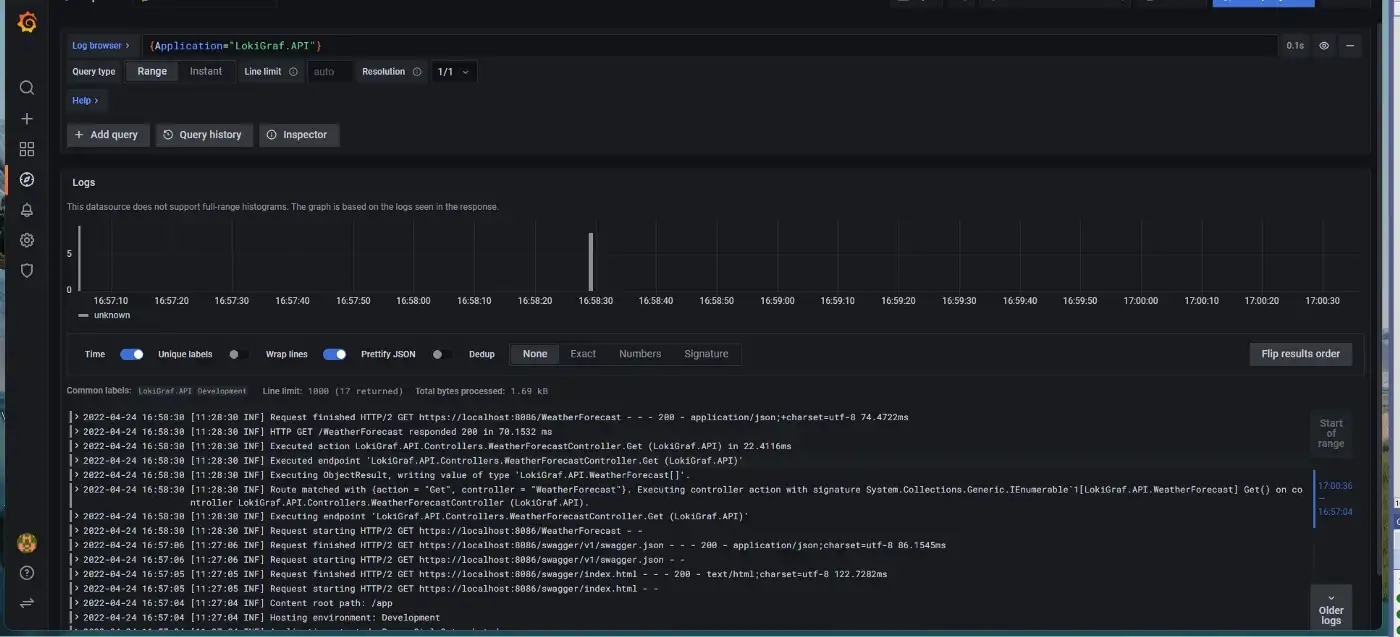
Application Logs
Easy peasy japanessey, our application log is configured, if we want we can also create some dashboards as well.