As a developer working on your current project, can you answer the following question: can your system at current state handle a new client with x1000 client compared to your existing user base? Will you know that running in production system has performance issues?
In this post I’ll describe how you can implement monitoring solution and load testing that uses free tools.
Performance related testing is a bit different from regular functional testing. Its goal is to check non functional requirements, like response times, First of all, test scenario is needed. We decided to test minimal happy flow that we expect our user to execute — start an interview, answer specified number of questions and complete an interview. To automate this flow k6 tool was chosen. It allows you to write test scripts using javascript, simple and provides good reporting. Other tools that are used:
- Survey Solutions — provides metrics during its execution
- Prometheus — gets metrics and stores them in internal storage
- Grafana to display results.
Overall load testing schema is the following:
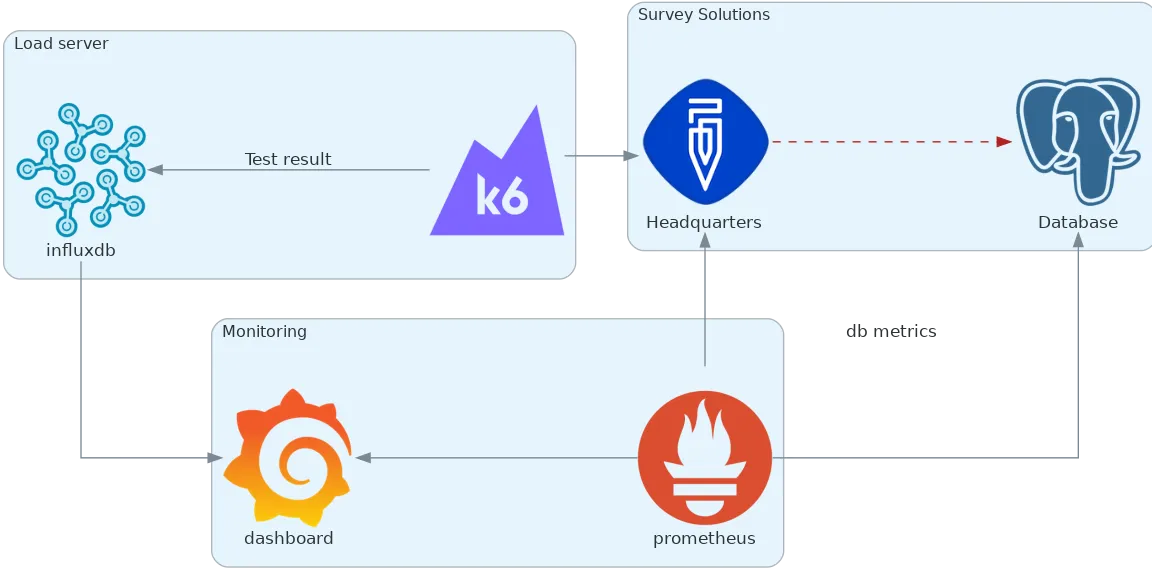
Load testing diagram
With such an environment available it is possible to run different versions of software and check performance iteratively during features implementation. Also it will allow us to determine how the application scales vertically by changing available resources to application and rerunning test.
Publishing metrics from ASP.NET Core application
Prometheus can collect data from web application for later analysis. There is a nuget package prometheus-net.AspNetCore that contains classes for collecting and publishing suitable metrics. To provide data for the prometheus your web application needs to start collecting it. For us 2 major sources are used: our custom middleware (collects http request related stats) and .net core EventCounter api (collects database related stats).
These are metrics that we would like to know about http requests:
- http_requests_in_progress — how many requests are being processed right now.
- http_requests_duration_seconds — milliseconds spent processing request.
- exceptions_total — unhandled exceptions counter.
There is a naming guide that I highly recommend reading before picking names for your metrics.
Simple middleware can be used to track those:
public class HttpMetricsMiddleware

{

    private readonly RequestDelegate next;

    private static readonly Gauge httpInProgress = Prometheus.Metrics.CreateGauge("http_requests_in_progress", "Number or requests in progress", "system");

    private static readonly Histogram httpRequestsDuration = Prometheus.Metrics.CreateHistogram("http_requests_duration_seconds", "Duration of http requests per tracking system", "system");


    public HttpMetricsMiddleware(RequestDelegate next)

    {

        this.next = next;

    }


    public async Task Invoke(HttpContext context)

    {

        string[] subsystem = new string[1];

        var path = context.Request.Path;


        // will not track request to diagnostics endpoints

        if (path.StartsWithSegments("/metrics"))

        {

            await next(context);

            return;

        }


        using var inprogress = httpInProgress.TrackInProgress();

        using var timer = httpRequestsDuration.NewTimer();


        try

        {

            await next(context);

        }

        catch (Exception)

        {

            CommonMetrics.ExceptionsOccur.Inc();

            throw;

        }

    }

}
Metric middleware
Now to the database access layer. We use npgsql and it produces metrics with EventCounter API that is present in .netcore 3 apps. In order to start listening to events you need to implement EventListener. It is registered in ASP.NET Core application as a hosted service so it is going to be instantiated by framework at application startup, call services.AddHostedService<NpgsqlMetricsCollectionService>() in your application startup ConfigureServices method. Basically all it does is transferring events from npgsql to prometheus. It publishes the amount of busy/idle database connections and traffic used between db and application.
internal sealed class NpgsqlMetricsCollectionService : EventListener, IHostedService

{

    public Task StartAsync(CancellationToken cancellationToken) => Task.CompletedTask;

    public Task StopAsync(CancellationToken cancellationToken) => Task.CompletedTask;


    protected override void OnEventWritten(EventWrittenEventArgs eventData)

    {

        if (eventData.EventName != "EventCounters"

            || eventData.Payload.Count <= 0

            || !(eventData.Payload[0] is IDictionary<string, object> data)

        )

            return;


        WriteCounters(data);

    }


    private void WriteCounters(IDictionary<string, object> eventPayload)

    {

        switch (eventPayload["Name"])

        {

            case "idle-connections":

                CommonMetrics.NpgsqlConnections.Labels("idle").Set(Convert.ToSingle(eventPayload["Mean"]));

                break;

            case "busy-connections":

                CommonMetrics.NpgsqlConnections.Labels("busy").Set(Convert.ToSingle(eventPayload["Mean"]));

                break;

            case "connection-pools":

                CommonMetrics.NpgsqlConnectionsPoolCount.Set(Convert.ToSingle(eventPayload["Mean"]));

                break;

            case "bytes-written-per-second":

                var written = Convert.ToSingle(eventPayload["Increment"]);

                if (written > 0) CommonMetrics.NpgsqlDataCounter.Labels("write").Inc(written);

                break;

            case "bytes-read-per-second":

                var read = Convert.ToSingle(eventPayload["Increment"]);

                if(read > 0 ) CommonMetrics.NpgsqlDataCounter.Labels("read").Inc(read);

                break;

        }

    }


    protected override void OnEventSourceCreated(EventSource eventSource)

    {

        if (eventSource.Name.Equals("Npgsql", StringComparison.OrdinalIgnoreCase))

        {

            EnableEvents(eventSource, EventLevel.Verbose, EventKeywords.None, new Dictionary<string, string>

            {

                {"EventCounterIntervalSec", "1"}

            });

        }

    }

}
public static class CommonMetrics

{

    public static Gauge NpgsqlConnections = new Gauge("npgsql_connections_current", "Number of connections managed by Npgsql (idle/busy)", "type");

    public static Gauge NpgsqlConnectionsPoolCount = new Gauge("npgsql_connection_pools_current", "Number of connection pools managed by Npgsql");

    public static Counter NpgsqlDataCounter = new Counter("npgsql_data_bytes_total", "Amount of byte read/write by Npgsql", "direction");

    public static Counter ExceptionsOccur = new Counter("exceptions_total", "Total number of exceptions happen on site during it's life time");

}
Event listener for npgsql related metrics
CPU and RAM usage are reported by prometheus package, you don’t need to add anything to have them.
All metrics are published after calling UseMetricServer method in Startup.Configure. Method is provided by the prometheus-net.AspNetCore package.
To check it is working open ‘/metrics’ url in browser. You should see metrics page rendered with stats.
K6
This is a great tool for doing different kinds of performance related testing. We are interested in load testing, the goal is to determine if a system is capable of handling predefined expected load in a given environment.
You can review code for the test, just to have an understanding how k6 api looks like in this gist. It’s very application specific, but you can find examples on how to pass arguments, do checks and web requests there.
k6 collects a lot of metrics regarding executed web requests and can post test results into influxdb. It posts very detailed data by default, for example it records the url of each web request, and if your script uses different urls during execution that produces tons of data. Before k6 configuration Influxdb consumed more than 30Gb of ram and all available CPU to handle such load and wasn’t able to respond to Grafana requests anyway. We had to remove all default tags that are attached to each request reporting, you can do it by providing an empty collection of systemTags property in your k6 script.
Prometheus
Default configuration was enough for us. Just add url of deployed website and it starts collecting metrics. Prometheus has its own alerting subsystem. So if you only need monitoring solution you can configure notifications in case of production issues. For example when application consumes too much memory or response time is greater than expected.
Grafana
We used grafana to display collected metrics. The nice thing is that it has a galley of premade dashboards, including a dashboard to display k6 load test results. It is a good starting point, after importing k6 dashboard, we can add our own graphs that load data from prometheus and influx.
For CPU reporting graph select Prometheus source with the following query:
rate(process_cpu_seconds_total[30s]) * 100
RAM can be reported with a simple graph from process_private_memory_bytes metric.
In order to display number of requests per second that server is handling based on server side measure we can add a graph with following query:
sum(irate(http_requests_duration_seconds_count[1m]))
Another interesting graph that can be built is heatmap of request duration that can be built by the following query to prometheus:
sum(increase(http_requests_duration_seconds_bucket[$__interval])) by (le)
And when you choose a heatmap graph type it will draw graph that shows that the majority of requests were processed around 25–50ms.
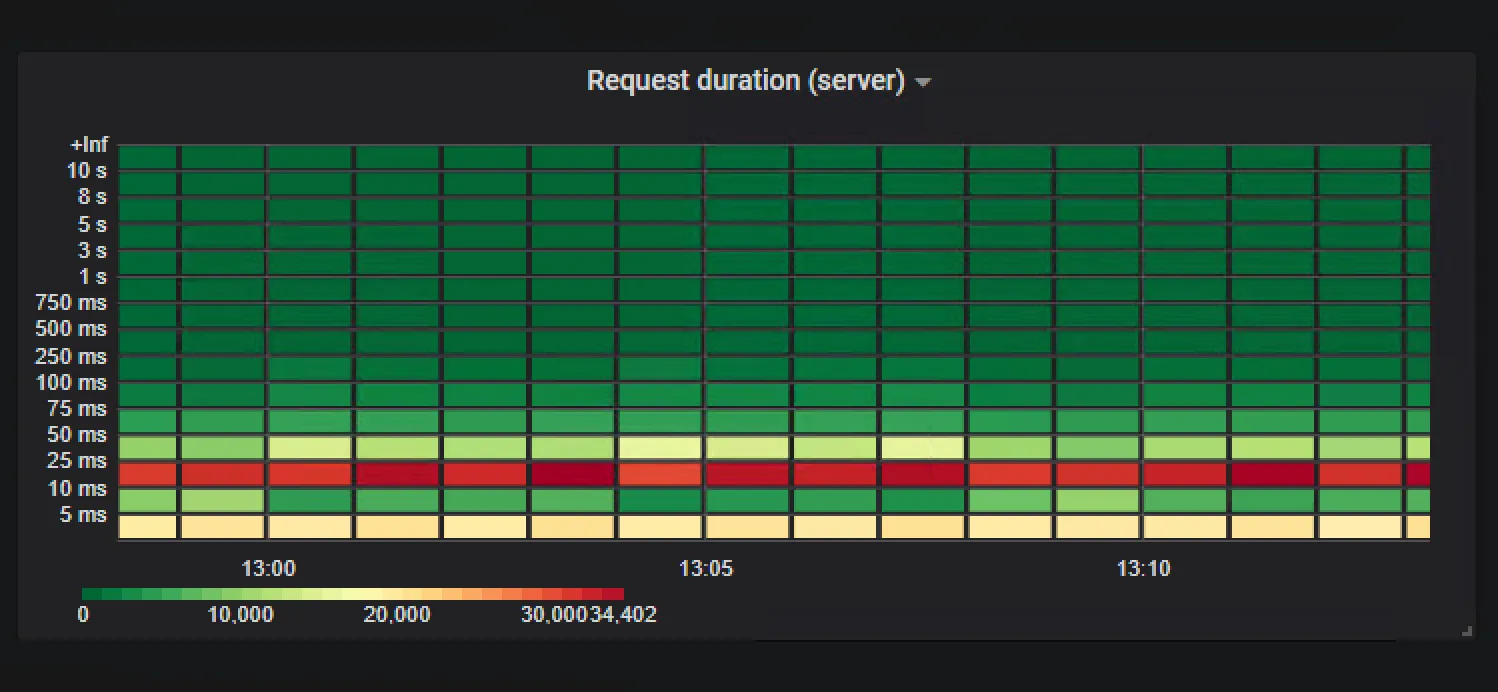
Heatmap. Request duration
To represent database connections usage npgsql_connections_current metric can be used. If stack option is selected in the visualisation tab then busy connections count are shown on top of idle. In such a way it’s easy to estimate total connection pool utilisation:
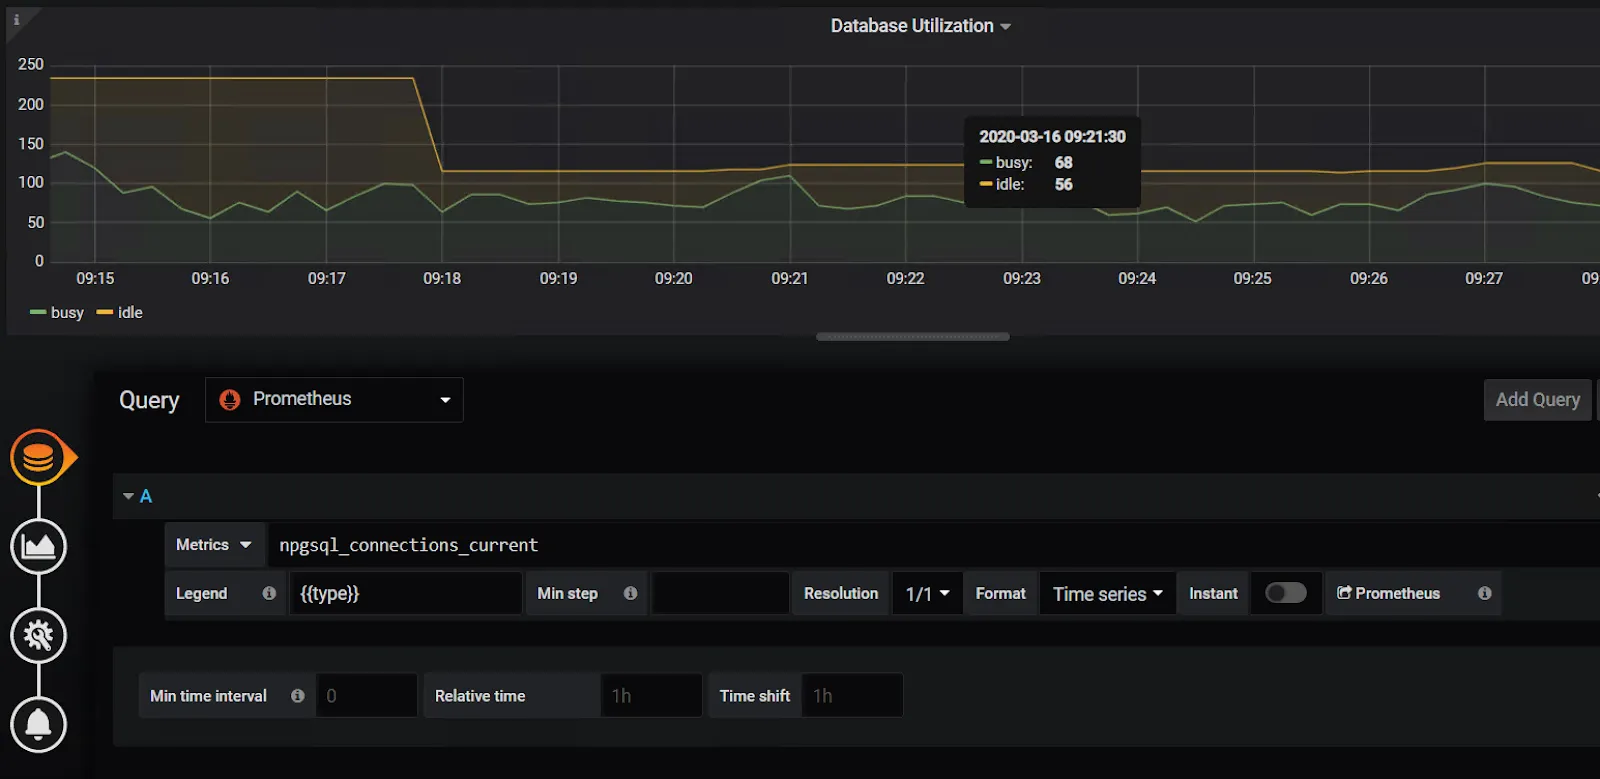
Database connections usage
For our testing we are using an overview dashboard that looks like following:
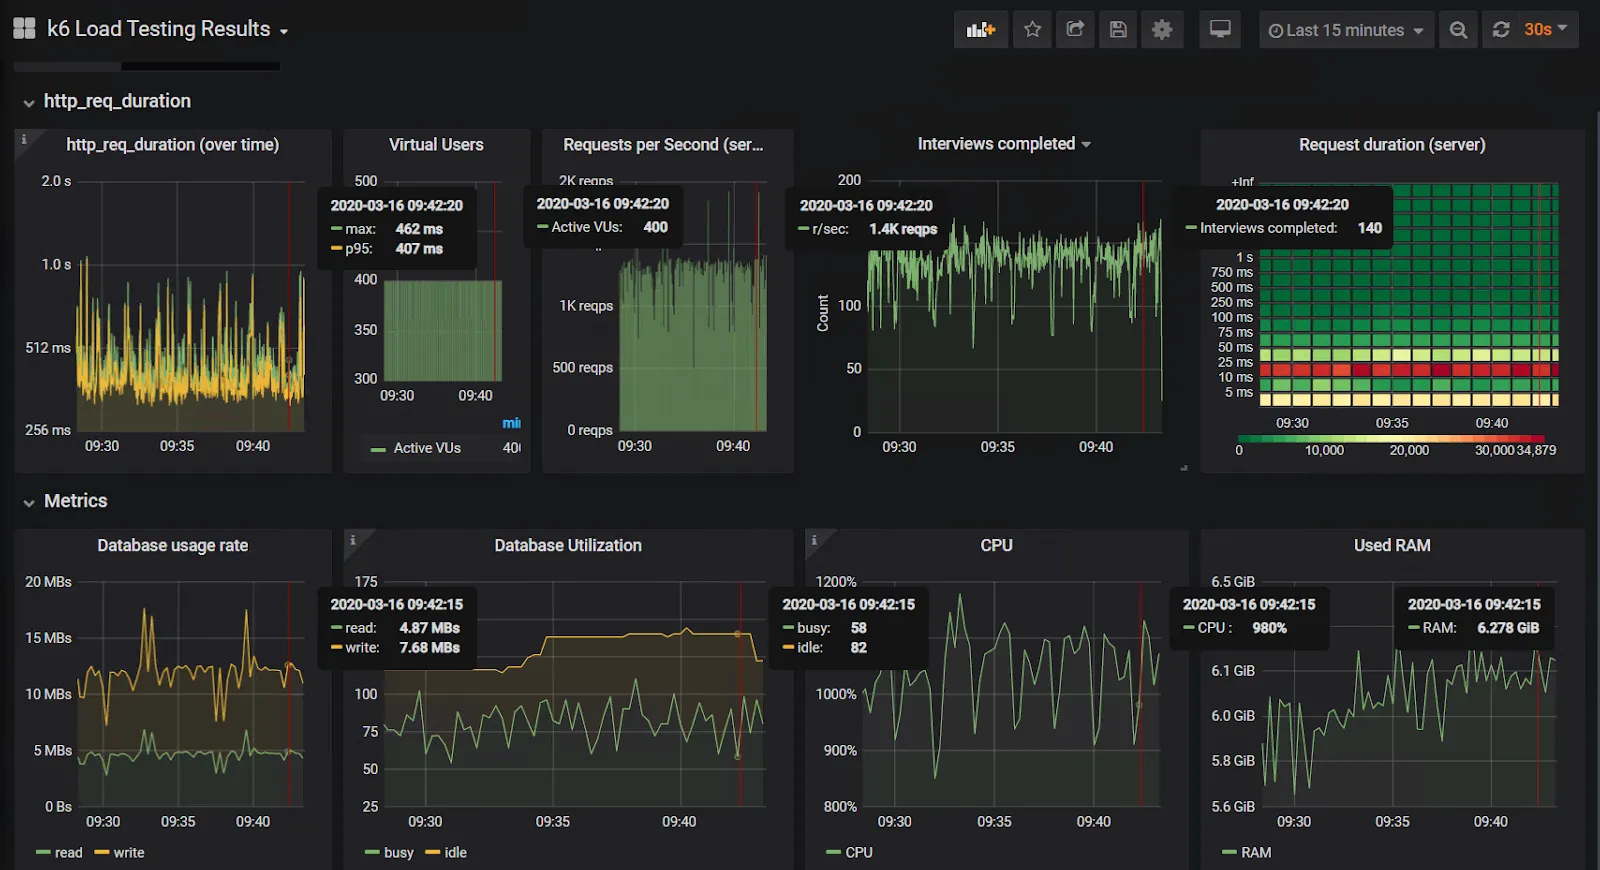
Performance counters overview
400 virtual users are able to complete 140 test scenarios (interviews completed) per second. Requests, in average, are processed in 0.5 second. In order to handle such load application uses 10 CPU cores and 7 gigs of RAM.
When you are able to run such test on a regular basis you won’t miss memory leaks or performance degradation between application versions.