.NET 8 introduced a powerful API in system diagnostics, making it seamless for developers to add custom application metrics adhering to the open telemetry standard. In this post, we’ll explore this new feature, demonstrating how it can be leveraged to publish metrics from a minimal API. Additionally, we’ll cover various approaches to test metrics and export them to Application Insights for creating insightful dashboards.
IMeterFactory was added to the system diagnostics namespace to help developers easily publish metrics from their application. Metrics can be used to capture valuable insights about your application such as:
- Business metrics like number of order, number of products sold, etc…
- Performance metrics such as API request duration
- Low level system metrics such as number of times a cache was refreshed, number of times a database connection is established, etc…
The IMeterFactory supports various instruments to cater to different situations. In .NET 8, these instruments include:
- Counter
- UpDownCounter
- ObservableCounter
- ObservableUpDownCounter
- ObservableGauge
- Histogram
Learn more about each instrument here
Creating a basic order counter
Let’s start by creating a minimal API endpoint for order creation and associating it with a basic meter.
app.MapPost("/orders", (

        [FromBody] OrderRequest request,

        [FromServices] IMeterFactory meterFactory) =>

    {

        var meter = meterFactory.Create("ClothingCo.Api.Meters");

        var orderCounter = meter

            .CreateCounter<int>("clothing_co.api.meters.orders");

        orderCounter.Add(1);


        Thread.Sleep(Random.Shared.Next(50, 500));

        return new OrderResponse(

            Guid.NewGuid().ToString(),

            request.ProductName,

            request.Quantity);

    })

    .WithName("CreateOrder")

    .WithOpenApi();


record OrderRequest(string ProductName, int Quantity);


record OrderResponse(string Id, string ProductName, int Quantity);
Refactoring for improved structure
While the previous example directly created meters in the endpoint, let’s improve the structure by extracting this logic into a separate class.
public sealed class ApiMeters

{

    private readonly Counter<int> _orderCounter;


    public static string MeterName = "ClothingCo.Api.Meters";

    public static string OrderCounterMeterName = "clothing_co.api.meters.orders";


    public ApiMeters(IMeterFactory meterFactory)

    {

        var meter = meterFactory.Create(MeterName);

        _orderCounter = meter.CreateCounter<int>(OrderCounterMeterName);

    }


    public void OrderPlaced()

    {

        this._orderCounter.Add(1);

    }

}
Before injecting this class into the orders endpoint we’ll need to register it in DI:
builder.Services.AddSingleton<ApiMeters>();
Now I’ll refactor the endpoint as to use the ApiMeter class instead of the IMeterFactory directly:
app.MapPost("/orders", (

        [FromBody] OrderRequest request,

        [FromServices] ApiMeters meters) =>

    {

        meters.OrderPlaced();


        Thread.Sleep(Random.Shared.Next(50, 500));

        return new OrderResponse(

            Guid.NewGuid().ToString(),

            request.ProductName,

            request.Quantity);

    })

    .WithName("CreateOrder")

    .WithOpenApi();
Capturing additional metrics using tags
The order counter is the most basic example but what if we wanted to track how many products were sold by the product name. For this we can use a feature of instrumentation called “Tags”.
To start I’ll add a new method to the ApiMeters class called “ProductSold”.
public sealed class ApiMeters

{

    private readonly Counter<int> _orderCounter;

    private readonly Counter<int> _productsSoldCounter;


    public static string MeterName = "ClothingCo.Api.Meters";

    public static string OrderCounterMeterName = "clothing_co.api.meters.orders";

    public static string ProductsSoldCounterMeterName = "clothing_co.api.meters.product_sold";


    public ApiMeters(IMeterFactory meterFactory)

    {

        var meter = meterFactory.Create(MeterName);

        _orderCounter = meter.CreateCounter<int>(OrderCounterMeterName);

        _productsSoldCounter = meter.CreateCounter<int>(ProductsSoldCounterMeterName);

    }


    public void OrderPlaced()

    {

        this._orderCounter.Add(1);

    }


    public void ProductSold(int quantity, string productName)

    {

        this._productsSoldCounter.Add(quantity,

            new KeyValuePair<string, object?>("product", productName));

    }

}
And I’ll update the minimal API endpoint to use the product sold meter.
app.MapPost("/orders", (

        [FromBody] OrderRequest request,

        [FromServices] ApiMeters meters) =>

    {

        meters.OrderPlaced();

        meters.ProductSold(request.Quantity, request.ProductName);


        Thread.Sleep(Random.Shared.Next(50, 500));

        return new OrderResponse(

            Guid.NewGuid().ToString(),

            request.ProductName,

            request.Quantity);

    })

    .WithName("CreateOrder")

    .WithOpenApi();
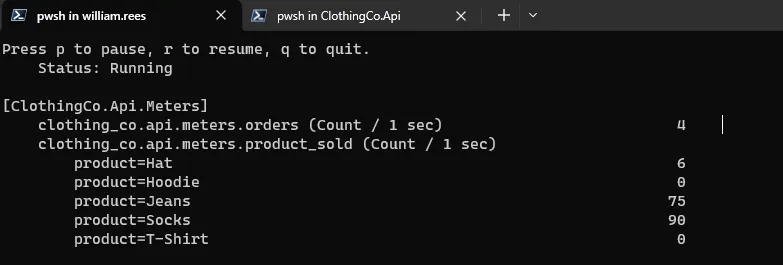
A simple way to test the new meters is to use the .NET counters cli tool. If you don’t have this installed follow the directions here:
https://learn.microsoft.com/en-us/dotnet/core/diagnostics/dotnet-counters
To view the metrics for order placed and product sold run your application and simultaneously run the CLI command:
dotnet counters monitor — counters ClothingCo.Api.Meters -p <PROCESS-ID>
Replacing <PROCESS-ID> with the process ID for your running application. After running the command and issuing requests to the POST /orders api you should see your new meters populated:
The dotnet counters tool is great for testing and monitoring meters in real time however its always better to write unit test and thankfully meters have made this easy with the MetricCollector.
The below unit test registers dependencies in the service provider and calls the product sold meter for hats and socks, the assert section then verifies that the metrics are recorded in the the MetricCollector.
[Fact]

public void ProductSold_Should_Count_Number_Of_Products_Sold_By_Quantity_And_Product_Name()

{

    // Arrange

    var services = CreateServiceProvider();

    var metrics = services.GetRequiredService<ApiMeters>();

    var meterFactory = services.GetRequiredService<IMeterFactory>();

    var collector = new MetricCollector<int>(meterFactory, ApiMeters.MeterName, ApiMeters.ProductsSoldCounterMeterName);


    // Act

    metrics.ProductSold(1, "Hat");

    metrics.ProductSold(3, "Socks");


    // Assert

    var measurements = collector.GetMeasurementSnapshot();

    Assert.Equal(2, measurements.Count);

    Assert.Equal(1, measurements[0].Value);

    Assert.Equal("Hat", measurements[0].Tags["product"]);

    Assert.Equal(3, measurements[1].Value);

    Assert.Equal("Socks", measurements[1].Tags["product"]);

}


private static IServiceProvider CreateServiceProvider()

{

    var serviceCollection = new ServiceCollection();

    serviceCollection.AddMetrics();

    serviceCollection.AddSingleton<ApiMeters>();

    return serviceCollection.BuildServiceProvider();

}
Exporting Meters to Application Insights
To export meters to application insights you’ll need to add the following nuget packages:
- OpenTelemetry.Extensions.Hosting
- Azure.Monitor.OpenTelemetry.Exporter
After adding these packages you’ll need to update your dependency registration to add open telemetry and the azure metrics exporter.
builder.Services.AddOpenTelemetry()

    .WithMetrics(metrics =>

    {

        metrics.AddMeter(ApiMeters.MeterName);

        metrics.AddAzureMonitorMetricExporter(x =>

        {

            // please store your connection string securly.

            // Comment if you want to know how :)

            x.ConnectionString = "YOUR CONNECTION STRING";

        });

    });
Using custom meters in Azure Application Insights
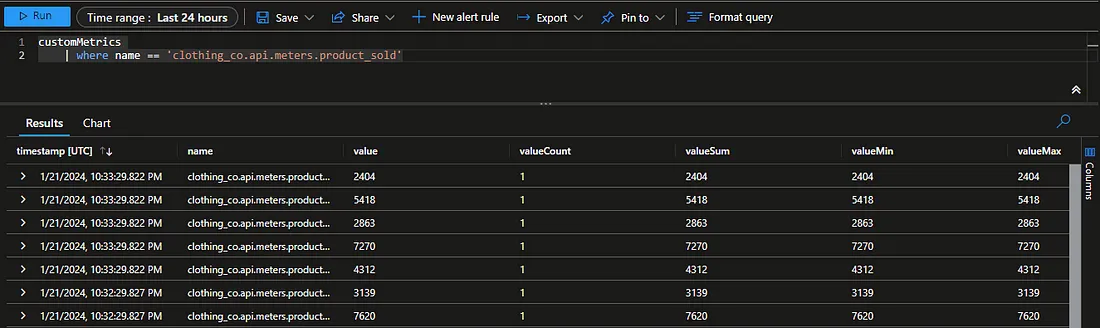
Now that our metrics are being exported to application insights we can query the data from the CustomMetrics logs table.
customMetrics

    | where name == 'clothing_co.api.meters.product_sold'
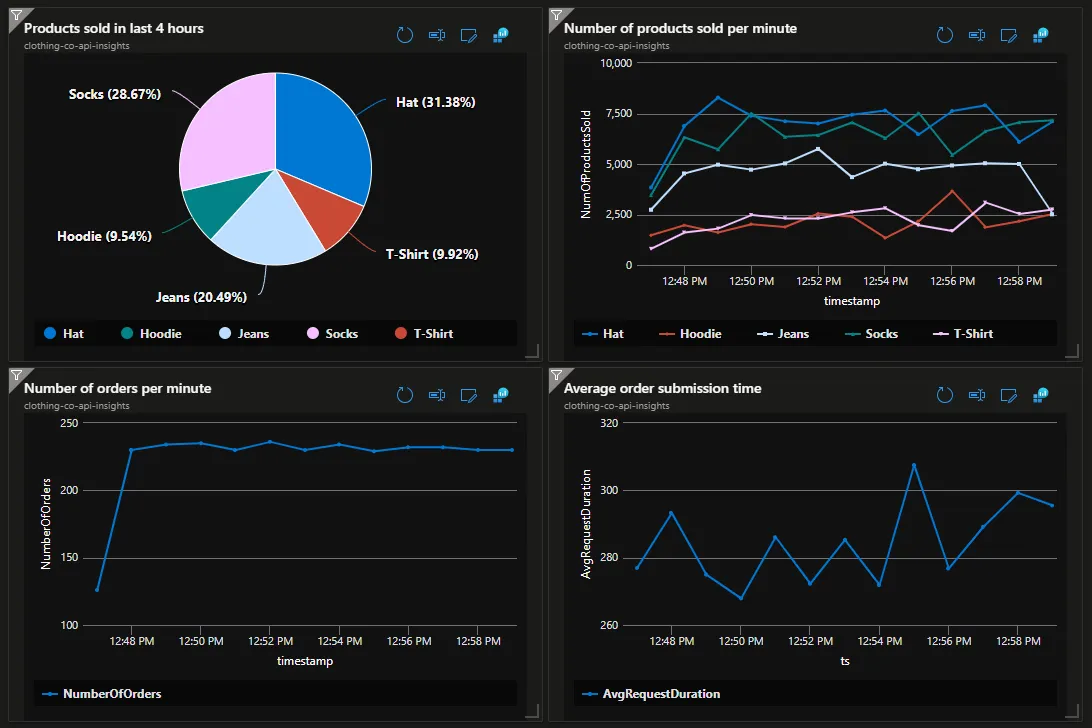
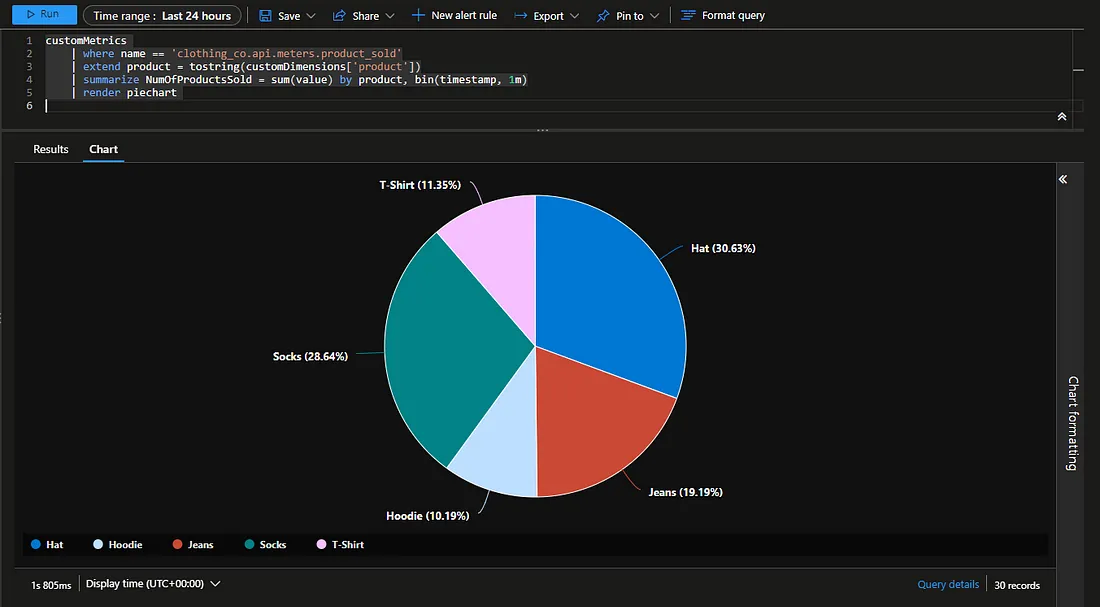
We can then visualize the number of product sold by product name with the following query.
customMetrics

    | where name == 'clothing_co.api.meters.product_sold'

    | extend product = tostring(customDimensions['product'])

    | summarize NumOfProductsSold = sum(value) by product, bin(timestamp, 1m)

    | render piechart
Best practices
- Meters should be should be created using the IMeterFactory. If your application doesn’t support dependency injection you should create the meter once per app domain
- Meter names should be unique to distinguish it from other meters. OpenTelemetry naming guidelines are recommended which use dotted hierarchical names. Assembly names or namespace names for code being instrumented are usually a good choice.
- NET doesn’t enforce any naming scheme for Instruments, but we recommend following OpenTelemetry naming guidelines, which use lowercase dotted hierarchical names and an underscore (‘_’) as the separator between multiple words in the same element. Not all metric tools preserve the Meter name as part of the final metric name, so it’s beneficial to make the instrument name globally unique on its own.
- Example instrument names:
• contoso.ticket_queue.duration
• contoso.reserved_tickets
• contoso.purchased_tickets
- 5. .NET APIs allow any string to be used as the unit, but we recommend using UCUM, an international standard for unit names. The curly braces around “{hats}” is part of the UCUM standard, indicating that it is a descriptive annotation rather than a unit name with a standardized meaning like seconds or bytes.
- 6. The unit specified in the constructor should describe the units appropriate for an individual measurement. This will sometimes differ from the units on the final metric. In this example, each measurement is a number of hats, so “{hats}” is the appropriate unit to pass in the constructor. The collection tool calculated a rate and derived on its own that the appropriate unit for the calculated metric is {hats}/sec.
Conclusion
In conclusion, the new MeterFactory in .NET provides a powerful toolset for developers to gather insightful metrics about their applications. By following best practices and adopting real-time monitoring and unit testing, you can ensure the effectiveness and accuracy of your custom metrics. Incorporating these practices will undoubtedly contribute to the overall health and performance of your applications.
More information about diagnostics and instrumentation: https://learn.microsoft.com/en-us/dotnet/core/diagnostics/metrics-instrumentation