Monitoring SQL Server for performance is a critical part of a DBA’s job. In this article, Edward Pollack explains some of the SQL Server performance monitor data and how to collect it.
Windows collects a wide array of useful metrics that can be used to measure the performance of the SQL Server service. By default, this data is available but not collected or retained in SQL Server. Therefore, it falls to a developer or administrator to choose to collect and use this data for performance analysis if they don’t have a tool like SQL Monitor to do it for them. This article introduces the performance monitor view, the data contained within it and prepares the reader to build a data collection solution that uses SQL Server performance monitor data.
Introducing dm_os_performance_counters
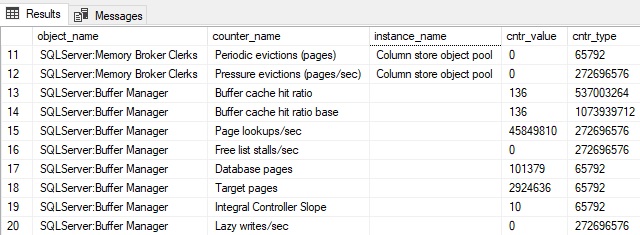
The view sys.dm_os_performance_counters will be front and center in this article, providing more information than there are pages to cover. The following is a subset of results when selecting everything from the view:

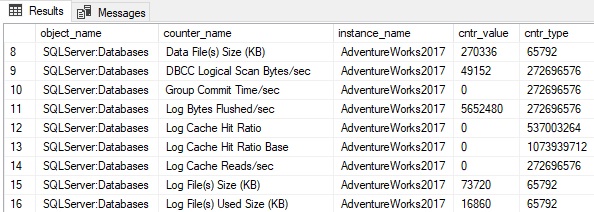
Each row represents a single performance counter and its measurement. Some are server-scoped, and others are database-scoped. A database-level performance counter will include the database name in the instance_name column, like this:

The instance_name column can contain an empty string but not NULL, so checking for a database name or other metadata is straightforward.
Cntr_value contains the current value for the performance counter.
Cntr_type is a system value that describes the type of counter. This can be useful, but once familiar with each counter and what it does, this type of column is of little value. Extensive detail on the types and what they mean can be found here:
WMI Performance Counter Types – Win32 apps | Microsoft Docs
To summarize the common counter types seen in this article and that will be typical in troubleshooting or capacity planning, the following list can be referenced:
|
Cntr_type
|
Meaning
|
|
65792
|
Provides a point-in-time snapshot of the last observed value. These are not averages or cumulative and can be used as-is.
|
|
272696320 & 272696576
|
These are cumulative values. To use these, two points in time must be compared, and the difference divided by time to calculate a metric-per-second value. These counters reset when the SQL Server service restarts.
|
|
537003264
|
Represents a ratio between a counter and its base. Each of these counters will have 2 values that need to be used together to calculate a meaningful result.
|
|
1073874176
|
Provides an average measure for an operation over time. Like 537003264, a base is provided and dividing by it is needed to obtain useful results.
|
|
1073939712
|
This is the base value needed for 537003264 and 1073874176
|
My local SQL Server 2019 test server with five databases returns 2000 rows in total from this view. Since some counters return database-level data, the number of rows returned by the view will increase as the number of databases increases.
What Can Be Measured?
The short answer is, “A LOT”. Counters are maintained and made available in SQL Server for an extensive selection of metrics. Some are common to all SQL Server installations, whereas others are associated with specific features (if they are installed/enabled).
Some of the more common objects that are useful to administrators and developers include: (Note that the heading contains the object_name, and the detail contains the counter_name)
SQLServer: Buffer Manager
The Buffer Manager measures usage of the buffer pool, telling us about memory usage, as well as the volume of data being written and read by SQL Server.
Page Life Expectancy: A measure of how long pages will remain in the buffer cache before they are removed and replaced with newer pages. When memory pressure occurs, older pages are removed from the cache more aggressively to make room for newer ones.
A decreasing value over time indicates increasing memory pressure. There is no universal target for this number, and memory expectations are different for different kinds of databases. For example, a transactional database where the same queries are executed repeatedly should have a high PLE that is stable over time. An analytic server with infrequent but large and inconsistent queries would see PLE change dramatically between quiet and busy periods.
This is an exceptionally useful metric that gains value when trended over a long period of time, both for alerting/monitoring, and for capacity planning. The number provided in the view indicates the value at the time the view was sampled:

Image showing page life expectancy SQL Server performance monitoring data
Since my local server has not recently processed any big data (and I have a lot of memory), the number is quite large. In this case, it has not experienced any memory pressure since it was restarted last, and hence a PLE of more than 23 days.
Page Reads /sec, Page Writes /sec, Page Lookups /sec, Lazy Writes /sec: Measures physical and logical reads and writes to/from the buffer cache. This provides an overall view of IO in SQL Server and the amount of IO that applications are performing against a database server. Page Reads and Page Writes indicate physical reads to/from the cache. Page Lookups measure the number of times data was requested from the cache. Lazy Writes measure the number of writes to storage outside of a checkpoint due to memory pressure.
Since physical IO is expensive, increasing numbers for physical reads can indicate memory pressure.
Since a page is 8kb, some arithmetic can describe the amount of IO on a given SQL Server. For example, if a server shows an average of 1million page reads per second and 10k page writes per second, it could be inferred that the buffer cache is servicing 7.629GB of reads per second and 78.125MB of writes per second (by dividing by 8,192 to get bytes and then converting to the storage unit of choice).
When captured over time, these metrics can describe overall trends, as well as indicate times when reads or writes are unusually high and should be investigated.
Note that all of these are cumulative counters that start at zero when SQL Server is restarted and are incremented indefinitely. To use this data meaningfully, multiple data points need to be collected and compared. This additional collection & arithmetic will be tackled later in this article.
Target Pages: This is the target number of pages that SQL Server wants to maintain in the buffer cache. Adding memory increases this number, whereas removing memory will reduce it. If the amount of data needed to regularly service queries is far greater than this number, then memory pressure will exist that will manifest in physical reads and a decreasing page life expectancy. As with other page-related data, multiplying by 8kb provides a raw amount of data. For example, on my local server, this counter currently shows:

This equates to about 21.49GB of data (2816743 * 8 / (10242)
SQLServer:General Statistics
These counters provide a variety of information at the server-level, with a focus on connections and important counts that are retained by SQL Server.
Logins /sec and Logouts /sec: These track cumulative counts of logins or logouts over time. Taking the difference between two samples provides the count of logins and logouts over that time frame. The following are two samples from my local server that are taken 10 minutes apart from each other:


The numbers above indicate, based on subtracting the second readings from the first, that there had been six logins and six logouts during the time in between samples. Sampling these counters regularly would allow for measurements every minute/hour/day for counts of logins and logouts to SQL Server.
Temp Tables Creation Rate: This provides a running total of temporary tables and table variables created in SQL Server. This can be a handy measure to gauge if there are processes on a server that are creating an excessive number of temporary objects, and when that creation is occurring most.
Note that this counter only measures table creation and not re-use. If T-SQL creates a temporary object and proceeds to use it for many operations, only its creation will be logged. The following code samples this counter before/after a temp table is created:
SELECT

    *

FROM sys.dm_os_performance_counters

WHERE object_name = 'SQLServer:General Statistics'

AND counter_name = 'Temp Tables Creation Rate';

CREATE TABLE #test2 (id INT);

SELECT

    *

FROM sys.dm_os_performance_counters

WHERE object_name = 'SQLServer:General Statistics'

AND counter_name = 'Temp Tables Creation Rate';

DROP TABLE #test2;

SELECT

    *

FROM sys.dm_os_performance_counters

WHERE object_name = 'SQLServer:General Statistics'

AND counter_name = 'Temp Tables Creation Rate';
The results show an increment by one when the temp table is created:

Note that dropping the temporary table had no impact on this performance counter. While expected, this is worth demonstrating.
SQLServer:SQL Statistics
These counters provide a look into query processing and can help quantify query volume across a server, as well as how execution plans are being generated for those queries.
All of the metrics below are cumulative. Therefore, multiple points in time need to be captured and compared to determine the change over time.
Batch Requests/sec: A cumulative measure of batches processed by SQL Server. As a speedy review, a batch is a collection of SQL statements executed together at the same time. This is a rough indicator of how much work SQL Server is doing overall. Expect batch requests to increase during busier times and decrease during quieter times.
Increasing batch requests over an extended period of time indicates that their source application is generating more work for SQL Server and capacity may eventually need to be updated to accommodate those changes. If capacity is not the issue, and such growth is unexpected, then increases in batch requests may indicate inefficiencies within the app that are generating more work that is needed.
This is one good metric to collect and retain for a long period of time as it provides a measure of SQL Server activity that is not directly tied to a specific resource, such as CPU, memory, or storage.
SQL Compilations/sec and SQL Re-Compilations/sec: These counters measure the activity of the query optimizer. When a query is executed for the first time, an execution plan is generated by the query optimizer that is cached and reused for future executions. In general, compilations will be high when:
- SQL Server or an application are first started.
- When workloads change drastically.
- When memory pressure forces plans out of the cache.
- When ad-hoc queries overwhelm the execution plan cache.
This is an exceptionally useful metric to collect as it measures plan cache activity independently of other system/SQL resources. Short-term increases in compilations may indicate app/server changes that generated a burst of plan cache activity whereas long-term increases typically represent an increase in ad-hoc query activity.
Recompilations occur when an existing execution plan in cache is discarded at runtime and replaced with a new plan. This can happen for a variety of reasons, such as:
- Significant data size changes after an execution plan is first compiled.
- A RECOMPILE hint is used.
- DDL changes to the underlying schema used in an execution plan.
- Changes in SET options that affect execution plans.
A full list of reasons can be found via this query:
SELECT

    *

FROM sys.dm_xe_map_values

WHERE dm_xe_map_values.name = 'statement_recompile_cause';
Recompilations will occur in any busy SQL Server, but should be kept low. If this number increases unexpectedly, then it’s worth investigating the cause. Increases in recompilations will ultimately result in increased CPU and slower queries as SQL Server needs to take time to generate a new execution plan rather than reuse an existing one.
Both compilations and recompilations can result from a variety of causes not discussed here, ranging from connection settings to database and server settings, or poorly written T-SQL. A deep discussion of the topic is out of scope for this article, but worth research if performance challenges are met in this area.
Database Counters: There is a wide variety of metrics that are collected at the database level that can provide more granular insight into server performance. Details are available about the size and usage of data/log files, transactions per second, log growths/shrinks, write transactions per second, and more. The instance_name column indicates the database name:

Be sure when collecting database-scoped metrics that they are captured for only the databases of interest and are stored in a format that differentiates them from server-scoped metrics.
And More!
A discussion of every counter in dm_os_performance_counters would consume hundreds of pages and bore the reader into a stupor. Needless to say, there is a wide variety of performance counters available to collect, analyze, and use in SQL Server.
Collecting and maintaining all of them would likely be a waste of resources. Instead, choose the ones that have the most utility for a given environment. Adding or removing counters at a later time is not difficult and is a better option than trying to keep track of everything.
Performance of dm_os_performance_counters
This view derives from a pair of system tables that are not indexed. Therefore, the performance of the view will be proportional to the number of rows returned by it. The row count returned will be primarily affected by the number of databases on a server.
On my local server with 6 user databases, that count is about 2000.
On another server with 92 user databases, the row count increases to about 7700.
On another server with 665 user databases, the row count increases to about 19681.
One yet another server with 4141 databases, the row count increases to about 278000.
Querying dm_os_performance_counters is speedy (sub-second) on the first three examples above, but quite slow on the fourth. This is a factor of both row count and the computing resources available on that server.
The lesson here is to test performance prior to using this code in a production environment. Ensure that it executes quickly, and if not, consider reducing the frequency of execution so that it is not simply running nonstop all day collecting counter data. It goes without saying that the collection of server and database metrics should in no way interfere with the server that is being monitored.
SQL Server Performance Monitor Data
SQL Server provides easy access to a vast array of performance counter data. It can be conveniently collected and stored directly in SQL Server and then analyzed using whatever tools of choice are available.
This provides a powerful window into server and database operations and can allow both for long-term capacity planning as well as short term altering and monitoring. Sudden drops in page life expectancy, for example, can be alerted on and additional data gathered to troubleshoot the problem. Similarly, slow long term drops in page life expectancy can be used to budget and schedule memory upgrades or code review of targeted parts of an application that have changed at the start of that time period.
The uses of this data are diverse and in the second part of this article, a process will be built that can collect and maintain this data for long-term storage and use.