A step by step guide to integrate OpenTelemetry with ASP.Net core and visualize in Jaeger.
OpenTelemetry is a collection of tools, APIs, and SDKs. Use it to instrument, generate, collect, and export telemetry data (metrics, logs, and traces) to help you analyze your software’s performance and behavior.
In this tutorial, we will look at how it can be integrated with ASP.NET core web project.
We will use Jaeger tool to analyze and visualize the telemetry data.
Let’s get started.
Project Setup
I have set up an API project and a Razor app.
Let’s setup API project first.
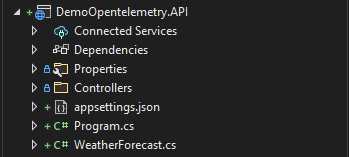
API Project
add the required nuget packages:
<PackageReference Include="OpenTelemetry.Exporter.OpenTelemetryProtocol" Version="1.2.0-rc3" />


<PackageReference Include="OpenTelemetry.Extensions.Hosting" Version="1.0.0-rc9" />


<PackageReference Include="OpenTelemetry.Instrumentation.AspNetCore" Version="1.0.0-rc9" />
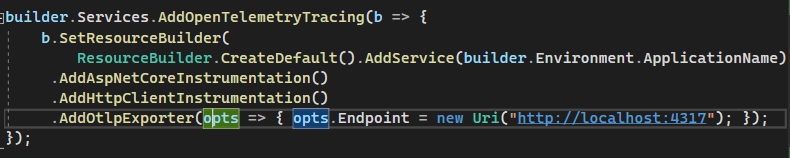
Now open Program.cs and add the following code:
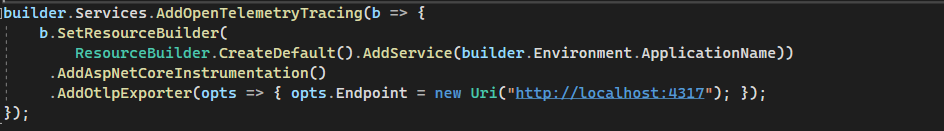
here we are setting up Jaeger’s URI as OLTP exporter endpoint.
Now let’s setup web app.
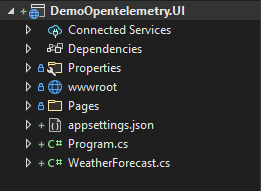
Web App Project
and also add required nuget packages:
<PackageReference Include="OpenTelemetry.Exporter.OpenTelemetryProtocol" Version="1.2.0-rc3" />


<PackageReference Include="OpenTelemetry.Extensions.Hosting" Version="1.0.0-rc9" />


<PackageReference Include="OpenTelemetry.Instrumentation.AspNetCore" Version="1.0.0-rc9" />


<PackageReference Include="OpenTelemetry.Instrumentation.Http" Version="1.0.0-rc9" />
Open Program.cs and add the following code:
we will need to make one more change, call the API and show the result on UI.
Open the Index.chtml.cs file and add the following code:
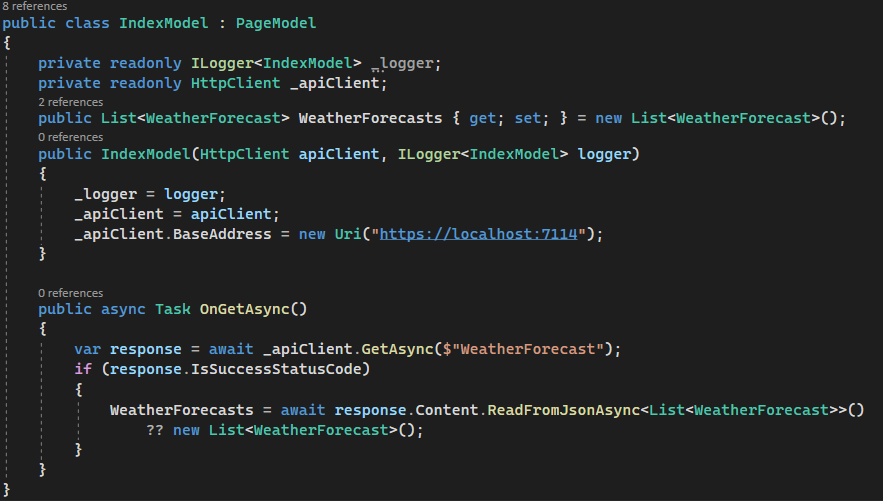
Index.chtml.cs
and open Index.html and add the following table:
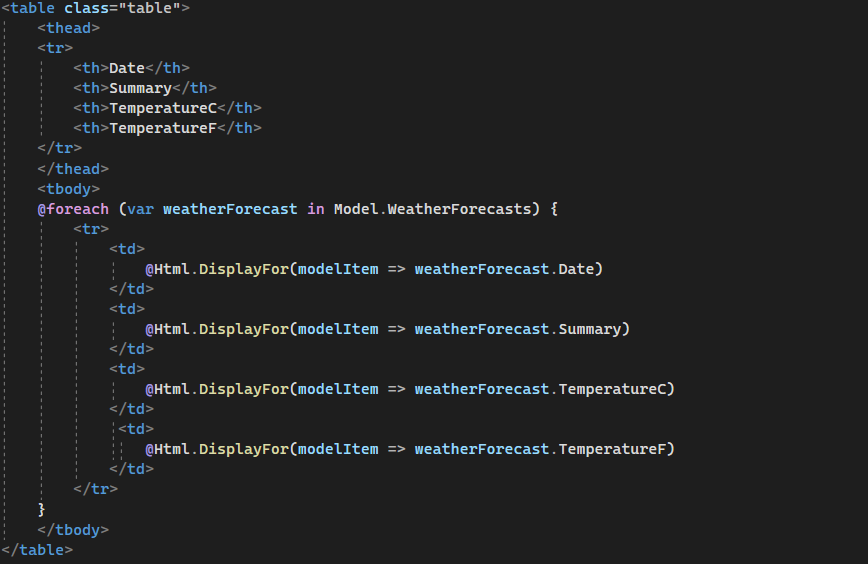
Index.html
add the following code in Program.cs:

Program.cs
we are ready to run the app.
Build both project and make sure they build with any errors.
Now let’s setup Jaeger.
Jaeger Setup
I am using docker setup.
Use the following cmd to create a docker container running for Jaeger:
docker run --name jaeger -p 13133:13133 -p 16686:16686 -p 4317:4317 -d --restart=unless-stopped jaegertracing/opentelemetry-all-in-one
To verify if it running successfully, Go to browser and open UI at http://localhost:16686
Execution
Let’s run the API and WebApp.
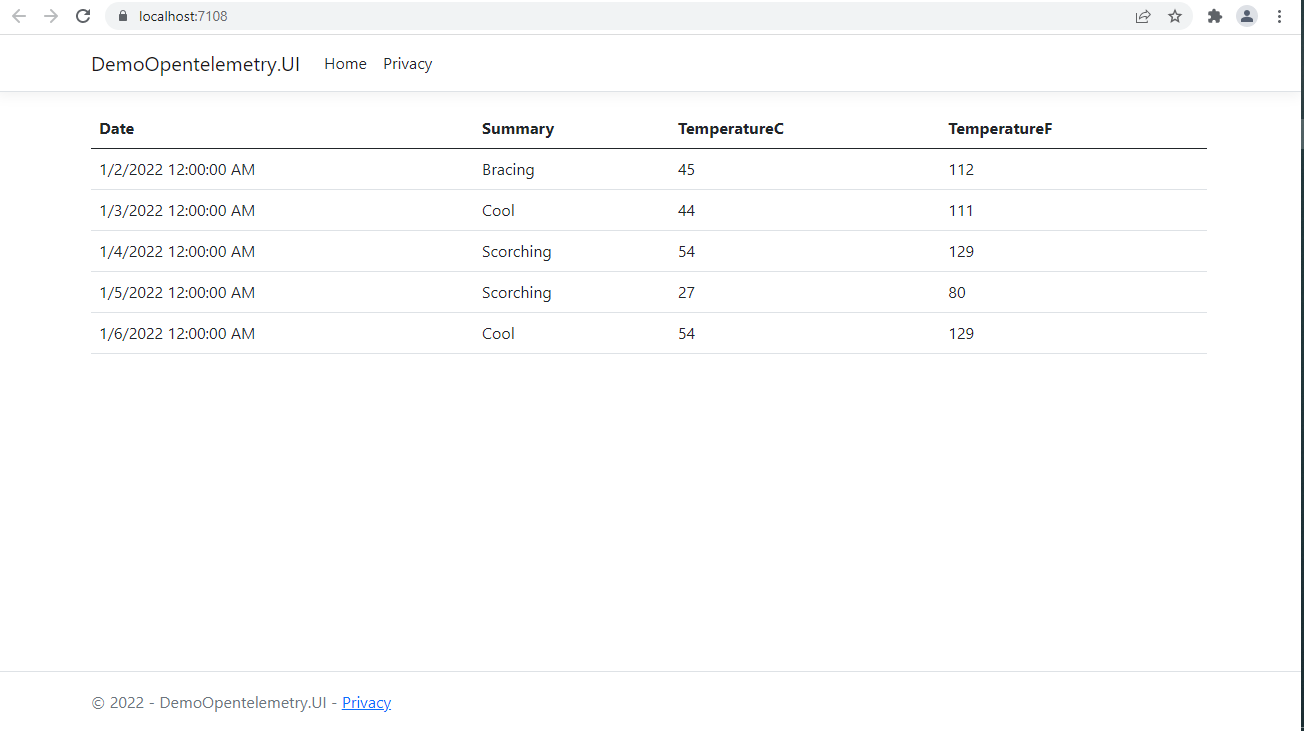
Web App UI
We can see the list of weather forecast on UI. which is being fetched using API project and displayed on UI.
Now Let’s look at the Jaeger UI.
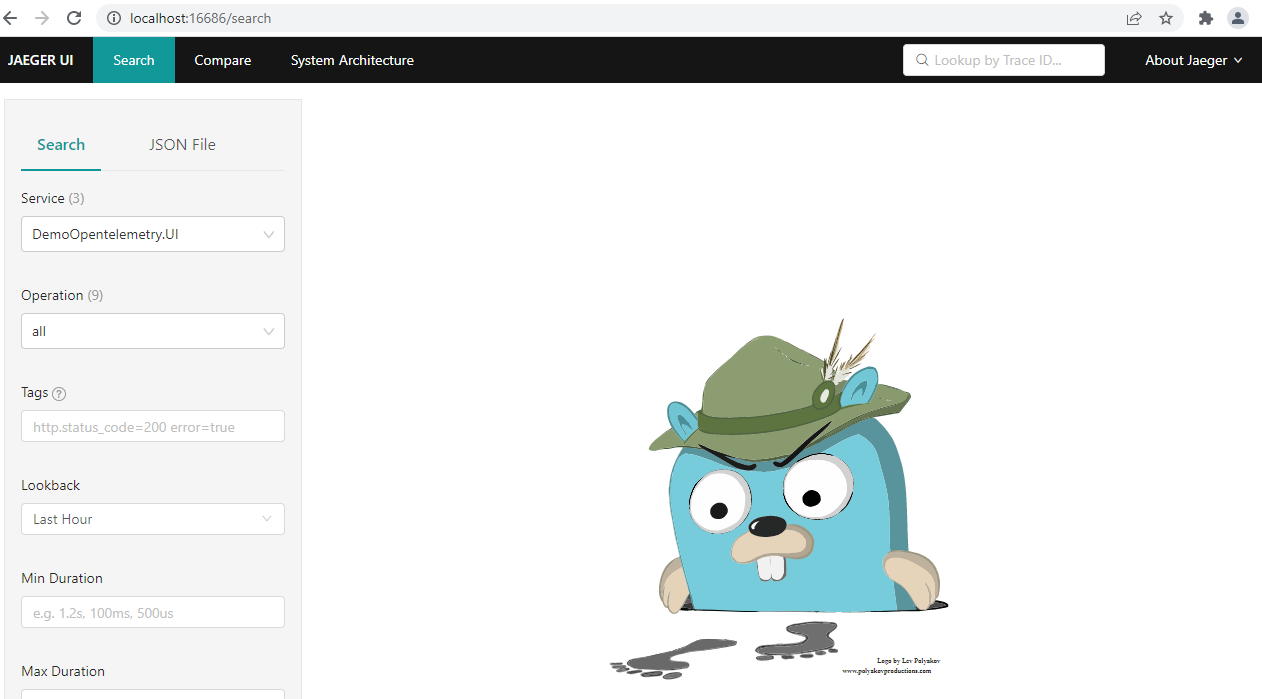
Jaeger UI
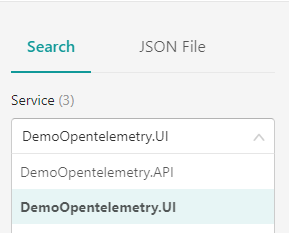
We can see both API and UI project is listed.
We can select operation from Operation drop down and Click on find trace.
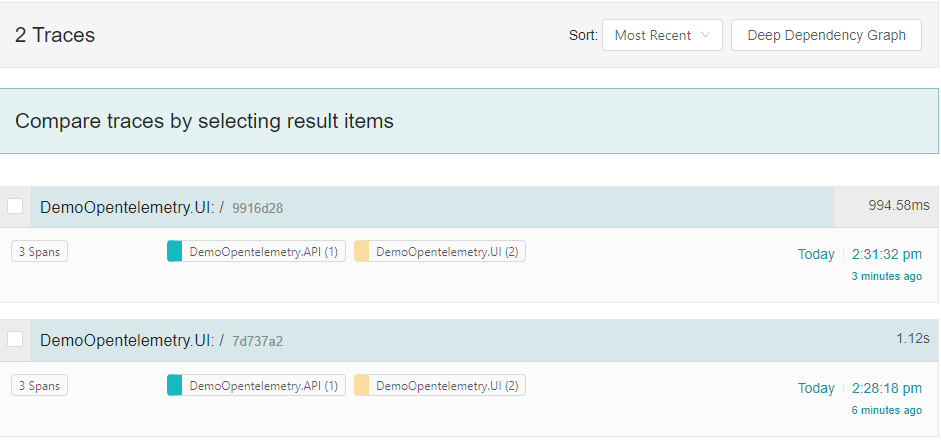
Trace
We can see multiple trace result, we select one for further analysis:
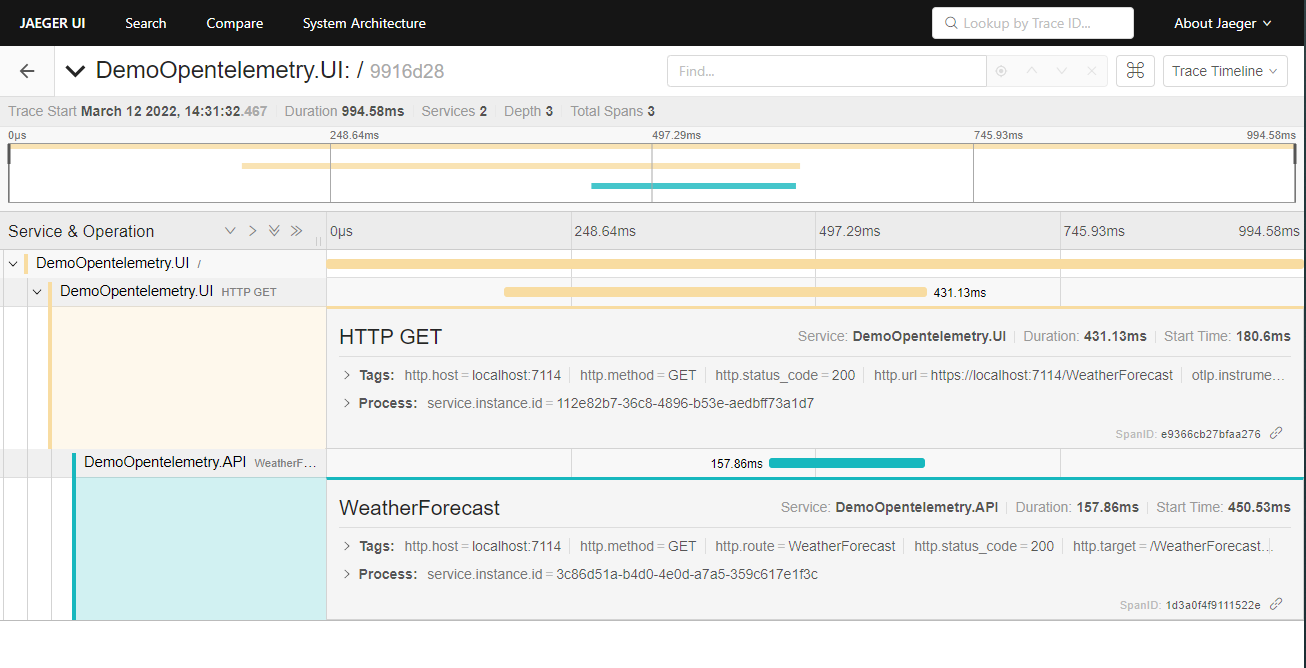
Trace detail
We can see the whole trace chain from UI to API with duration and start time.
Demo code at Github
Summary
It is very easy to setup Opentelemetry in .NET application. although I have use jaeger tool for analysis but there are many other tools are available and if they all follow same standard then they can also be used without any other changes.
Hope is it helpful.
Happy coding and keep learning!