Performance is a key factor that determines the success and user satisfaction of a web application. Users expect fast and responsive websites, and any delays or hiccups can result in frustration, abandoned sessions, and lost business opportunities. That's why it is important for developers to identify and address performance bottlenecks in ASP.NET Application.
In this article, we will guide you through the performance bottlenecks in ASP.NET Application. After that, we will describe different types of performance bottlenecks and their techniques to identify and address them. At the end of the article, we will provide the best practices to eliminate performance bottlenecks in ASP.NET Applications.
Table of content:
- What are Performance Bottlenecks in ASP.NET Application?
- Common Performance Bottlenecks
- Tools and Techniques to Identify Bottlenecks in ASP.NET Application
- Best Practices to Optimize and Improve the Performance of ASP.NET Application
- Conclusion
What are performance bottlenecks in ASP.NET Application?
Performance bottlenecks in ASP.NET Application are roadblocks that slow down performance and make it less efficient. These roadblocks can happen because of slow code, too many database queries, delays in network communication, not having enough resources, or not designing the application in the best way.
When bottlenecks occur, the application can slow down, stop responding, or even crash, which frustrates users, causes missed business opportunities, and harms the application's reputation.
Consider the image which shows the performance bottlenecks in the ASP.NET application. You can scale linearly by adding more web/worker roles and virtual machines to handle the increasing load.
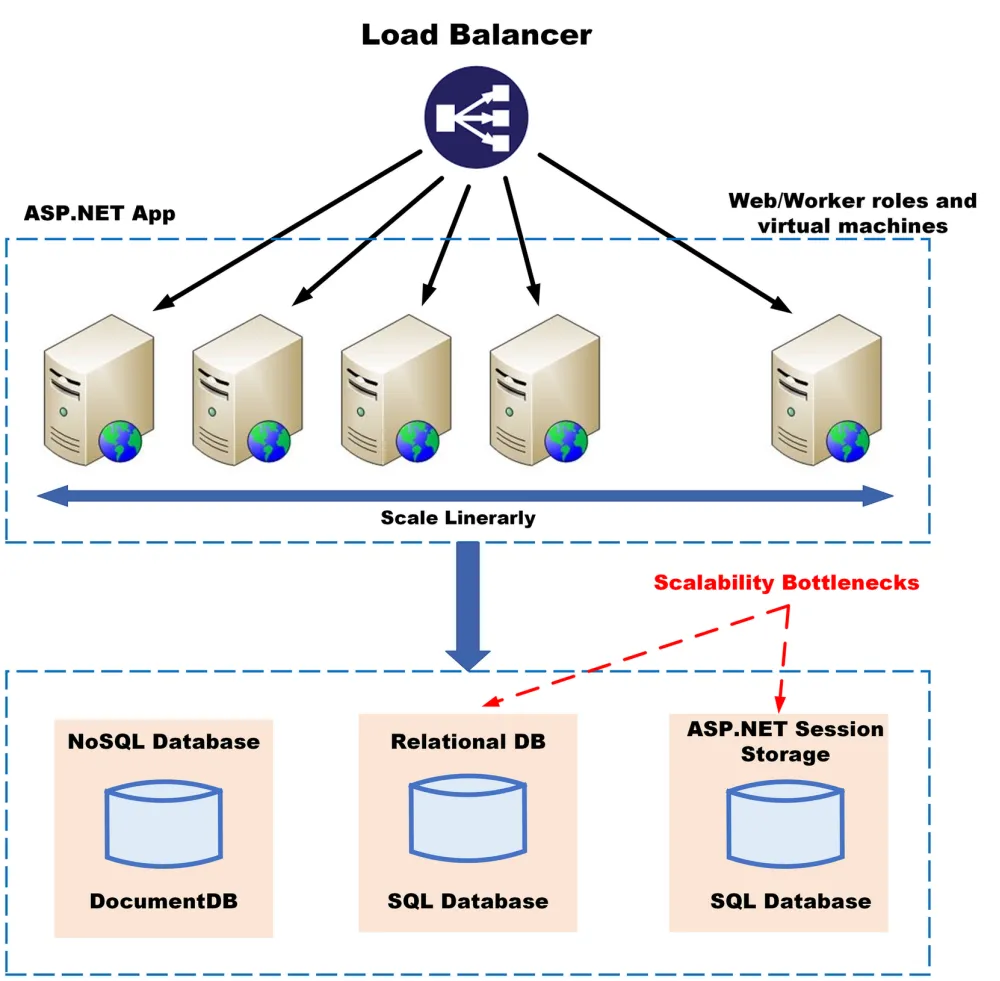
However, there are bottlenecks at the database layer. There are three types of databases: NoSQL (DocumentDB), relational (SQL Database), and ASP.NET session storage (SQL Database) and each database has different performance issues like delays, capacity, multiple users, and availability.
To avoid or reduce these bottlenecks, it's important to optimize database design, configuration, and queries in ASP.NET applications.
By finding and fixing the bottlenecks, developers can make the application faster, more responsive, and better at using its resources. This leads to an improved user experience, higher efficiency, and the ability to handle more users without issues.
Common performance bottlenecks in ASP.NET Applications
Below are some of the common Performance bottlenecks in ASP.NET Application:
- Exception and Logs
- Thread Synchronization and Locking
- Application Hangs
- Garbage Collection Pauses
- IIS Server Bottlenecks
- Slow Database Calls
- Infrastructure Issues
1. Exceptions, and Logs
Exceptions are errors or abnormal conditions that occur during the execution of the application. Logs are records or messages that provide information about the events or activities that occur during the execution of the application. Both exceptions and logs are useful for debugging and troubleshooting purposes, but they can also affect the performance of the application if they are not handled or managed properly.
For example, if the application throws too many unhandled exceptions, it can cause memory leaks, resource exhaustion, or poor responsiveness. If the application logs too many messages, it can cause disk IO, network traffic, or CPU overhead.
// Example of throwing an unhandled exception

public void Divide(int x, int y)

{

    // This will throw a DivideByZeroException if y is zero

    int result = x / y;

    Console.WriteLine(result);

}


// Example of logging too many messages

public void ProcessData()

{

    // This will log every iteration of the loop, which can be excessive

    for (int i = 0; i < 1000; i++)

    {

        Logger.Info($"Processing data {i}");

        // Do some work

    }

}
2. Thread Synchronization and Locking
Thread synchronization and locking ensure that multiple threads can access shared resources or data safely and consistently. Thread synchronization and locking are necessary to prevent race conditions, data corruption, or concurrency issues, but they can also affect the performance of the application if they are overused or misused.
For example, if the application uses too many synchronized blocks or locks, it can cause contention and blocking issues among threads, resulting in poor scalability and responsiveness.
// Example of using too many synchronized blocks

public class Counter

{

    private int count = 0;


    // This method is synchronized, which means only one thread can access it at a time

    public void Increment()

    {

        lock (this)

        {

            count++;

        }

    }


    // This method is also synchronized, which means only one thread can access it at a time

    public void Decrement()

    {

        lock (this)

        {

            count--;

        }

    }


    // This method is also synchronized, which means only one thread can access it at a time

    public int GetCount()

    {

        lock (this)

        {

            return count;

        }

    }

}
3. Application Hangs
Application hangs are situations where the application becomes unresponsive or stops responding to user requests or inputs. Application hangs can occur for various reasons, such as deadlocks, infinite loops, resource exhaustion, or unresponsive external services. Application hangs can affect the performance of the application by consuming more resources, increasing response time, or causing timeouts.
// Example of causing a deadlock

public class Account

{

    private int balance = 0;


    public void Deposit(int amount)

    {

        lock (this)

        {

            balance += amount;

        }

    }


    public void Withdraw(int amount)

    {

        lock (this)

        {

            balance -= amount;

        }

    }


    public void Transfer(Account other, int amount)

    {

        lock (this) // This will acquire the lock on this account

        {

            lock (other)

            // This will try to acquire the lock on the other account

            {

                Withdraw(amount);

                other.Deposit(amount);

            }

        }

    }

}


// If two threads try to transfer money between two accounts in opposite directions,

// they will cause a deadlock because each thread will hold one lock and wait for the other


Account a = new Account();

Account b = new Account();


Thread t1 = new Thread(() => a.Transfer(b, 100)); // This will lock a and wait for b

Thread t2 = new Thread(() => b.Transfer(a, 200)); // This will lock b and wait for a


t1.Start();

t2.Start();


// The application will hang because neither thread can proceed
4. Garbage Collection Pauses
Garbage collection is a process that automatically reclaims memory from objects that are no longer used by the application. Garbage collection pauses are periods of time when the garbage collector suspends all the threads in the application and performs memory cleanup. Garbage collection pauses are necessary to prevent memory leaks and ensure optimal memory usage, but they can also affect the performance of the application by degrading the throughput and latency.
// Example of causing frequent garbage collection pauses

public void GenerateData()

{

    // This will create a lot of short-lived objects that will fill up the heap quickly

    for (int i = 0; i < 1000000; i++)

    {

        var data = new Data(i);

        // Do some work with data

    }

}


// The garbage collector will have to run frequently to reclaim memory from these objects

// This will cause frequent pauses in the application execution
5. IIS Server Bottlenecks
IIS server bottlenecks are performance issues that occur at the web server level, where the ASP.NET application is hosted and served. IIS server bottlenecks can arise due to various factors, such as misconfiguration, insufficient resources, or high concurrency. IIS server bottlenecks can affect the performance of the application by increasing the request queue, reducing the throughput, or causing errors.
// Example of causing an IIS server bottleneck

public void ProcessRequest(HttpContext context)

{

    // This will simulate a long-running request that takes 10 seconds to complete

    Thread.Sleep(10000);

    context.Response.Write("Hello World");

}


// If the application receives a lot of concurrent requests, it will quickly exhaust the available threads in the IIS thread pool


// This will cause the request queue to grow and the response time to increase


// This will also cause some requests to fail with errors such as "503 Service Unavailable" or "500 Internal Server Error"
6. Slow Database Calls
Slow database calls are performance issues that occur at the data access layer, where the ASP.NET application interacts with the database or other data sources. Slow database calls can affect the performance of the application by increasing the response time and consuming more resources. Slow database calls can be caused by various factors, such as inefficient queries, network latency, database contention, or data size.
// Example of causing a slow database call

public void GetData()

{

    using (var connection = new SqlConnection(connectionString))

    {

        connection.Open();

        // This will execute a query that returns a large amount of data from the database

        var command = new SqlCommand("SELECT * FROM Products", connection);

        var reader = command.ExecuteReader();

        while (reader.Read())

        {

            // Do some work with the data

        }

    }

}


// This query will take a long time to execute and transfer the data over the network

// This will affect the performance of the application by blocking the thread and increasing the response time
7. Infrastructure Issues
Infrastructure issues are performance issues that occur at the physical or virtual level, where the ASP.NET application and its dependencies are deployed and run. Infrastructure issues can impact the performance of the application by limiting or degrading the available resources, such as CPU, memory, disk, or network. Infrastructure issues can be caused by various factors, such as hardware failure, resource contention, configuration errors, or security threats.
// Example of causing an infrastructure issue

public void DoWork()

{

    // This will consume a lot of CPU cycles by performing a complex calculation

    var result = Math.Pow(Math.PI, Math.E);

    Console.WriteLine(result);

}


// If the application runs on a machine that has limited or shared CPU resources,

// it will affect the performance of the application by reducing the throughput and increasing the latency
Tools and techniques to identify performance bottlenecks in ASP.NET Applications
Below are some tools and techniques which will help you to identify the performance bottlenecks in ASP.NET Application:
- Performance Counters
- Profiling Tools
- Debugging Tools
- Logging Tools
- Tracing tools
Performance Counters:
Performance counters are metrics that measure various aspects of the system and application performance, such as CPU usage, memory usage, request rate, response time, etc.
You can use the below tools to monitor and analyze:
- PerfMon,
- dotTrace, or
- NCache
For example, you can use PerfMon to view the performance counters for ASP.NET applications, such as Requests/Sec, Requests Queued, Errors Total/Sec, etc. You can also create custom performance counters using the System.Diagnostics namespace.
// Example of creating a custom performance counter

using System.Diagnostics;


// Create a new category and counter

if (!PerformanceCounterCategory.Exists("MyCategory"))

{

    var counterData = new CounterCreationDataCollection();

    var counter = new CounterCreationData();

    counter.CounterName = "MyCounter";

    counter.CounterHelp = "My custom counter";

    counter.CounterType = PerformanceCounterType.NumberOfItems32;

    counterData.Add(counter);

    PerformanceCounterCategory.Create("MyCategory", "My custom category", PerformanceCounterCategoryType.SingleInstance, counterData);

}


// Create an instance of the counter

var myCounter = new PerformanceCounter("MyCategory", "MyCounter", false);


// Increment the counter value myCounter.Increment();
Profiling Tools:
Profiling tools are software applications that help you analyze the code execution and identify the hotspots, memory leaks, or performance issues in your application.
You can use the below tools to profile your application:
- Visual Studio Profiler,
- dotMemory, or
- ANTS Performance Profiler to profile your application.
For example, you can use Visual Studio Profiler to collect and analyze CPU and memory usage data for your application. You can also use the Diagnostic Tools window to profile your application while debugging.
Debugging Tools:
Debugging tools are software applications that help you find and fix errors or bugs in your code.
You can use the below tools to debug your application:
- Visual Studio Debugger,
- WinDbg, or
- dotPeek
For example, you can use Visual Studio Debugger to set breakpoints, inspect variables, evaluate expressions, step through code, etc. You can also use the Exception Settings window to configure how the debugger handles exceptions.
Logging Tools:
Logging tools are software applications that help you record and review the events or messages that occur during the application execution.
You can use the below tools to log your application:
- Enterprise Library,
- NLog, Serilog,
- log4net
For example, you can use NLog to log messages to various targets, such as files, databases, consoles, etc. You can also configure the logging levels, layouts, filters, etc.
// Example of using NLog

using NLog;


// Create a logger instance

var logger = LogManager.GetCurrentClassLogger();


// Log messages with different levels

logger.Trace("Trace message");

logger.Debug("Debug message");

logger.Info("Info message");

logger.Warn("Warn message");

logger.Error("Error message");

logger.Fatal("Fatal message");
Tracing Tools:
Tracing tools are software applications that help you track and visualize the flow of requests or transactions across different components or services in your application.
You can use the below tools to trace your application:
- Application Insights,
- Dynatrace, or
- New Relic
For example, you can use Application Insights to collect and analyze telemetry data from your application, such as requests, dependencies, exceptions, events, etc. You can also use the Application Map feature to view the dependencies and performance of your application components.
Best practices to optimize and improve the performance of ASP.NET Application
Here are some best practices and recommendations to optimize and improve the performance of ASP.NET applications, along with examples and code snippets:
Best Practice 1: Use proper exception handling and logging strategies:
Exceptions and logs can affect the performance of the application if they are not handled or managed properly. You should use proper exception handling and logging strategies, such as:
- Use try-catch-finally blocks to handle exceptions gracefully and avoid unhandled exceptions that can cause memory leaks or resource exhaustion.
- Use exception filters to specify conditional clauses for each catch block and avoid catching generic exceptions that can hide the root cause of the error.
- Use logging frameworks such as Enterprise Library, NLog, Serilog, or log4net to log exceptions and events to various targets, such as files, databases, consoles, etc.
- Configure the logging levels and filters to log only the relevant and necessary information and avoid logging too many messages that can cause disk IO, network traffic, or CPU overhead.
- Use structured logging to log structured data instead of plain text messages and make it easier to query and analyze the logs.
// Example of using proper exception handling and logging strategies

using NLog;


// Create a logger instance

var logger = LogManager.GetCurrentClassLogger();


// Use try-catch-finally blocks to handle exceptionstry

{

    // Do some work that may throw an exception

    var result = Divide(10, 0);

    Console.WriteLine(result);

}

catch (DivideByZeroException ex) when (ex.Message.Contains("zero"))

// Use exception filters to specify conditional clauses

{

    // Log the exception with a specific level and message

    logger.Error(ex, "Division by zero error");

    // Handle the exception accordingly

    Console.WriteLine("Cannot divide by zero");

}

catch (Exception ex) // Avoid catching generic exceptions

{

    // Log the exception with a specific level and message

    logger.Error(ex, "Unknown error");

    // Handle the exception accordingly

    Console.WriteLine("Something went wrong");

}

finally

{

    // Do some cleanup work

    Console.WriteLine("End of operation");

}


// Use structured logging to log structured data

logger.Info("User {UserId} logged in at {LoginTime}", userId, loginTime);
Best Practice 2: Avoid excessive thread synchronization and locking:
Thread synchronization and locking can affect the performance of the application if they are overused or misused. You should avoid excessive thread synchronization and locking, such as:
Use async/await keywords to write asynchronous code that can run in parallel without blocking threads or waiting for locks.
// Use async/await keywords to write asynchronous code

public async Task ProcessDataAsync()

{

    // Do some work that does not depend on other tasks

    Console.WriteLine("Starting task");


    // Await other tasks that may take a long time to complete

    var task1 = GetDataAsync();

    var task2 = SaveDataAsync();


    // Continue with other work that depends on the awaited tasks

    var data = await task1;

    Console.WriteLine($"Got data: {data}");


    await task2;

    Console.WriteLine("Saved data");


    // Do some final work that does not depend on other tasks

    Console.WriteLine("Ending task");

}
Use concurrent collections such as ConcurrentDictionary or ConcurrentBag instead of normal collections that require locks for thread safety.
// Use concurrent collections instead of normal collections

public void UpdateCounter()

{

    // Use a concurrent dictionary instead of a normal dictionary

    var counter = new ConcurrentDictionary<string, int>();


    // Use TryAdd or AddOrUpdate methods instead of locks

    counter.TryAdd("key", 1);

    counter.AddOrUpdate("key", k => k + 1, (k, v) => v + 1);


    Console.WriteLine(counter["key"]);

}
Use Interlocked class methods such as Increment or CompareExchange instead of locks for atomic operations on shared variables.
// Use Interlocked class methods instead of locks

public void IncrementCount()

{

    // Use a shared variable instead of a normal variable

    int count = 0;


    // Use Interlocked.Increment method instead of locks

    Interlocked.Increment(ref count);


    Console.WriteLine(count);

}
Use ReaderWriterLockSlim class instead of lock keyword for scenarios where there are more read operations than write operations on a shared resource.
// Use ReaderWriterLockSlim class instead of lock keyword

public void AccessResource()

{

    // Use a reader-writer lock instead of a normal lock

    var rwLock = new ReaderWriterLockSlim();


    // Use TryEnterReadLock and TryEnterWriteLock methods instead of lock keyword

    if (rwLock.TryEnterReadLock(1000))

    {

        try

        {

            // Do some read-only work on the shared resource

            Console.WriteLine("Reading resource");

        }

        finally

        {

            // Release the read lock

            rwLock.ExitReadLock();

        }

    }


    if (rwLock.TryEnterWriteLock(1000))

    {

        try

        {

            // Do some write-only work on the shared resource

            Console.WriteLine("Writing resource");

        }

        finally

        {

            // Release the write lock

            rwLock.ExitWriteLock();

        }

    }

}
Best Practice 3: Prevent application hangs and deadlocks:
Application hangs and deadlocks can consume more resources, increase response time, or cause timeouts. You should prevent application hangs and deadlocks, such as:
Use CancellationTokenSource and CancellationToken classes to cancel long-running or unresponsive tasks and free up resources.
// Use CancellationTokenSource and CancellationToken classes to cancel tasks

public async Task ProcessDataAsync()

{

    // Create a cancellation token source and a cancellation token

    var cts = new CancellationTokenSource();

    var ct = cts.Token;


    // Pass the cancellation token to the long-running task

    var task = GetDataAsync(ct);


    // Cancel the task after a timeout or a user input

    cts.CancelAfter(10000);

    Console.CancelKeyPress += (s, e) => cts.Cancel();


    try

    {

        // Await the task and handle the result or exception

        var data = await task;

        Console.WriteLine($"Got data: {data}");

    }

    catch (OperationCanceledException ex)

    {

        // Handle the task cancellation

        Console.WriteLine("Task was canceled");

    }

    catch (Exception ex)

    {

        // Handle other exceptions

        Console.WriteLine("Task failed");

    }

}
Use Task.WhenAll or Task.WhenAny methods to await multiple tasks and handle their completion or failure.
// Use Task.WhenAll or Task.WhenAny methods to await multiple tasks

public async Task ProcessMultipleDataAsync()

{

    // Create multiple tasks that may take a long time to complete

    var task1 = GetDataAsync();

    var task2 = SaveDataAsync();


    // Await all tasks and handle their results or exceptionstry

    {

        var results = await Task.WhenAll(task1, task2);

        Console.WriteLine("All tasks completed successfully");

    }

    catch (Exception ex)

    {

        Console.WriteLine("One or more tasks failed");

    }


    // Await any task and handle its result or exceptiontry

    {

        var result = await Task.WhenAny(task1, task2);

        Console.WriteLine("One task completed successfully");

    }

    catch (Exception ex)

    {

        Console.WriteLine("One task failed");

    }

}
Use ConfigureAwait(false) method to avoid capturing the synchronization context and causing deadlocks when awaiting tasks.
// Use ConfigureAwait(false) method to avoid deadlocks when awaiting tasks

public async Task GetDataAsync()

{

    // Do some work that does not depend on the current context

    Console.WriteLine("Starting task");


    // Await another task without capturing the current context

    var data = await GetRemoteDataAsync().ConfigureAwait(false);


    // Do some work that does not depend on the current context

    Console.WriteLine($"Got data: {data}");


    return data;

}
Best Practice 4: Tune garbage collection settings and memory management:
Garbage collection pauses can degrade the throughput and latency. You should tune garbage collection settings and memory management, such as:
Use GCSettings class to configure the garbage collection mode, latency mode, or large object heap compaction mode according to your application needs.
// Use GCSettings class to configure the garbage collection mode, latency mode, or large object heap compaction mode

public void ConfigureGC()

{

    // Set the garbage collection mode to workstation or server

    GCSettings.IsServerGC = true;


    // Set the latency mode to low latency or interactive

    GCSettings.LatencyMode = GCLatencyMode.Interactive;


    // Set the large object heap compaction mode to compact once or default

    GCSettings.LargeObjectHeapCompactionMode = GCLargeObjectHeapCompactionMode.CompactOnce;

}
Use GC class methods such as Collect, WaitForPendingFinalizers, or SuppressFinalize to control the garbage collection behavior explicitly.
// Use GC class methods to control the garbage collection behavior explicitly

public void ControlGC()

{

    // Force a garbage collection for all generations

    GC.Collect();


    // Wait for all finalizers to complete

    GC.WaitForPendingFinalizers();


    // Suppress the finalizer for an object that does not need it

    var obj = new MyClass();

    GC.SuppressFinalize(obj);

}
Use MemoryCache class or IMemoryCache interface to implement caching strategies for frequently used data and reduce memory pressure.
// Use MemoryCache class or IMemoryCache interface to implement caching strategies

public void UseCache()

{

    // Create a memory cache instance

    var cache = MemoryCache.Default;


    // Add an item to the cache with a sliding expiration policy

    var item = new CacheItem("key", "value");

    var policy = new CacheItemPolicy();

    policy.SlidingExpiration = TimeSpan.FromMinutes(10);

    cache.Add(item, policy);


    // Get an item from the cache or create it if it does not exist

    var value = cache.Get("key") ?? CreateValue("key");

}
Use IDisposable interface or use the statement to dispose of unmanaged resources such as files, streams, sockets, etc. as soon as possible.
// Use IDisposable interface or using statement to dispose unmanaged resources

public void DisposeResources()

{

    // Implement IDisposable interface for a class that holds unmanaged resources

    public class MyResource : IDisposable

    {

        private Stream stream;

        private bool disposed;

        public MyResource(string path)

        {

            stream = File.OpenRead(path);

        }

        public void Dispose()

        {

            Dispose(true);

            GC.SuppressFinalize(this);

        }


        protected virtual void Dispose(bool disposing)

        {

            if (!disposed)

            {

                if (disposing)

                {

                    // Dispose managed resources

                    stream.Dispose();

                }


                // Dispose unmanaged resources

                disposed = true;

            }

        }

    }


    // Use using statement for a class that implements IDisposable interface

    using (var resource = new MyResource("path"))

    {

        // Do some work with the resource

    }

    // The resource will be disposed automatically at the end of the using block

}
That's It!