
This tutorial focuses on the elements of Apache Superset, a modern tool for Data Collection, Visualization, and Exploration. Apache Superset is one of the most comprehensive open-source Business Intelligence tools though it is very easy to use. It is faster and more efficient than existing similar tools, and it comes with varying features that enable users to process their data in different forms.
Hence, using the tool will enhance your business’ preparation of data for better strategy formulation and implementation. To help you understand this tool without any hassle, the fundamentals of Apache Superset are explained in detail. At the end of this tutorial, you will be able to decide if Apache Superset is a good fit for your business, as this blog covers the features, benefits, and uniqueness of the tool alongside how it works.
Table of Contents
- What is Apache Superset?
- The Features of Apache Superset
- The Benefits of Apache Superset
- How to Set Up a Dashboard in Apache Superset?
- Step 1: Connecting to a New Database
- Step 2: Selecting a Table to be Exposed
- Step 3: Column Properties Customization
- Step 4: Creating Charts in Explore
- Step 5: Creating a Dashboard and a Slice
- Conclusion
What is Apache Superset?
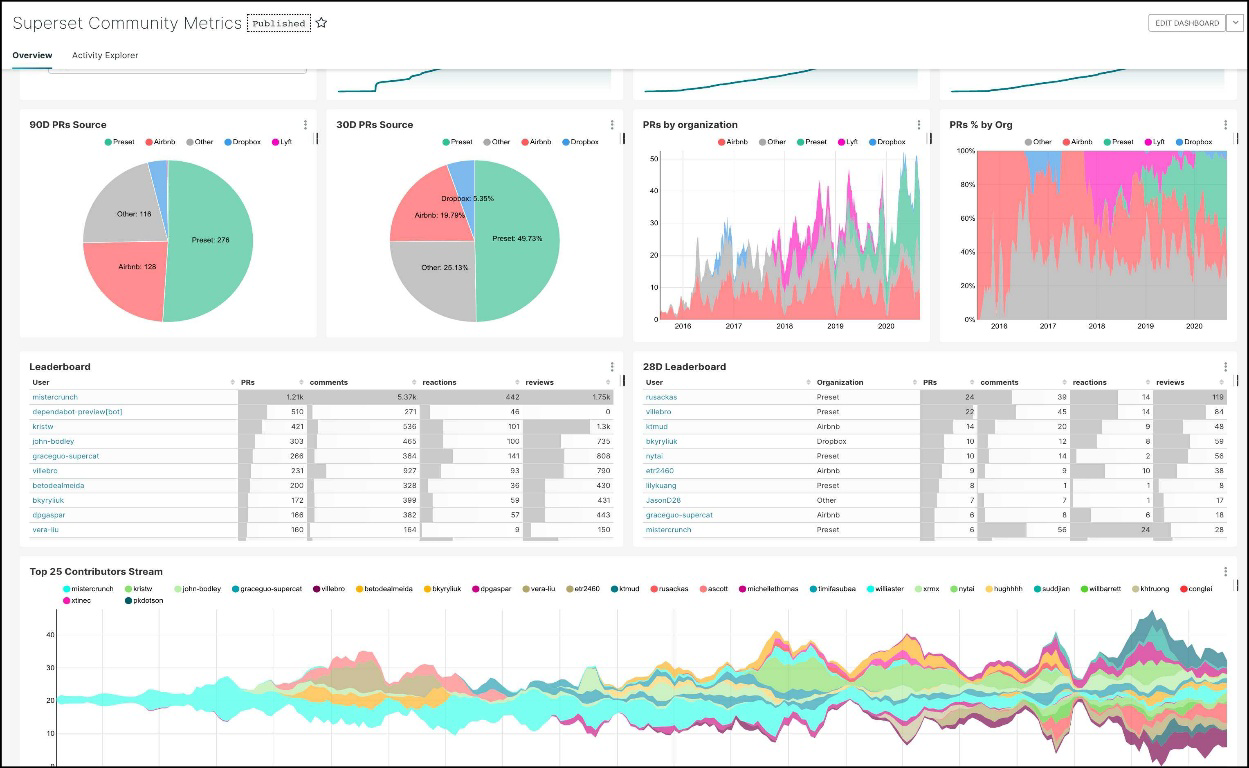
Apache Superset is an easy-to-use Business Intelligence tool that collects and processes data in large volumes to produce visualized results like charts and graphs. Thus, the web application allows users to generate dashboards and reports which aid business growth.
Little wonder that it is the choice of many companies across the world. Some of the top companies using it are Udemy, Airbnb, Shopkick, and Lyft. Being an open-source tool whose source code is accessible to developers, it is very flexible.
You can customize the tool to meet your specific needs by modifying some of its functions. You also have the freedom to select the Webserver, Metadata Database Engine, Message Queue, Results Backend, and Caching Layer for the Business Intelligence tool.
Similarly, Apache Superset is cloud-native, and it is compatible with numerous options in each of the aforementioned customization categories. For instance, you can choose one of Nginx, Apache, and Gunicorn in the Webserver category. MySQL, MariaDB, and Postgres are some of the options available for you when choosing a Metadata Database Engine.
The Results Backend, Caching Layer, and Message Queue categories are no exemptions. In the Caching Layer category, your developers can choose to work with Redis, Memcached, etc. In the Results Backend category, you have different options ranging from Memcached to S3 and Redis while SQS, RabbitMQ, and Redis are available in the Message Queue category.
The Features of Apache Superset
- Effective and Efficient Performance: It is designed to process your data accurately within a short period. The open-source tool uses the simple no-code builder system or SQL IDE to explore data seamlessly, generating different visual outputs like simple pie charts and deck.gl geospatial charts.
- User-friendly Interface: Even though it is powerful and efficient, it is very easy to use. The tool’s interface is simple and requires no special expertise to navigate. As such, getting started with it guarantees a positive user experience.
- Excellent Visual System: It produces high-quality Data Visualizations that are both amazingly beautiful and creative. This feature makes your Data Exploration tasks interesting and much easier.
- Scalability: It is highly scalable, as it can process different data sizes while maintaining its optimal performance.

- Wide Range of Database Support: A lot of databases are compatible with Apache Superset. Some of the supported databases are Amazon Redshift, Druid, Google Big Query, Click House, Dremio, Exasol, Firebird, Greenplum, Oracle Database, Presto, PostgreSQL, Snowflakes, SQ Lite, Vertica, Rockset, Trino, Monet DB, and IBM DB2.
The Benefits of Apache Superset
- Guaranteed Data Security: The most important benefit of this tool Superset is the protection it offers your data and your company’s privacy by extension. This tool gives you total control over the accessibility of your data. Specifically, it empowers you to add users to your database, permit them and track their activities.
- Dual Modes: It is available in both application and web forms, and each works independently of the other. The values you get from using the tool’s application are the same you get from its web version. In essence, this tool is the only Business Intelligence tool that can be fully used on all popular browsers. You, therefore, do not need any additional installation package to use the tool on the web.
- Doesn’t Require Code: The knowledge of coding is not needed to use it. Non-programmers can, thus, use the open-source tool if they understand the basics of SQL.
- Interactive Queries: With this tool, you can choose a database, table, and schema for an interactive query. You can preview and also save the result of the query for future purposes. Though you cannot run multiple queries at a time, each query supplies organized information that guides your company’s policies, decisions, and strategies.
How to Set Up a Dashboard in Apache Superset?
To set up a dashboard in Apache Superset you need to understand how to connect it to a new database and configure a table in that database for analysis. Finally, you will be exploring the data you’ve exposed and add a visualization to the dashboard you created to get the complete end-to-end user experience. Here are the steps involved in this process:
- Step 1: Connecting to a New Database
- Step 2: Selecting a Table to be Exposed
- Step 3: Column Properties Customization
- Step 4: Creating Charts in Explore
- Step 5: Creating a Dashboard and a Slice
Step 1: Connecting to a New Database
Apache Superset doesn’t have a storage layer to store your data so it pairs with your existing SQL-speaking Data Store or database.
You need to add the connection credentials to your database to allow you to query and visualize data from it.
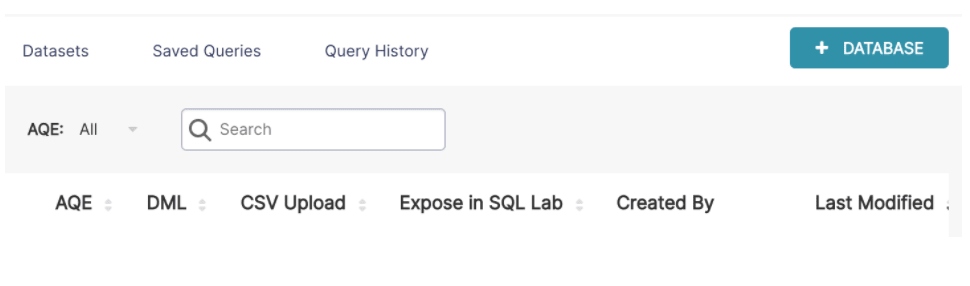
Under the Data Menu, click on the Databases option:
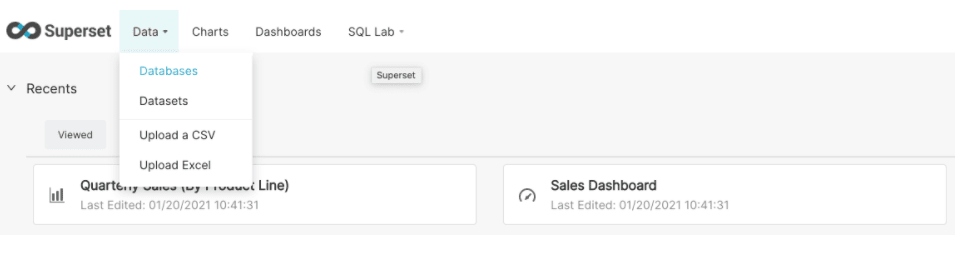
Click on the green + Database button in the top right corner:
You can configure various advanced options in this window, but for now, the SQLAlchemy URI and the database name will suffice.
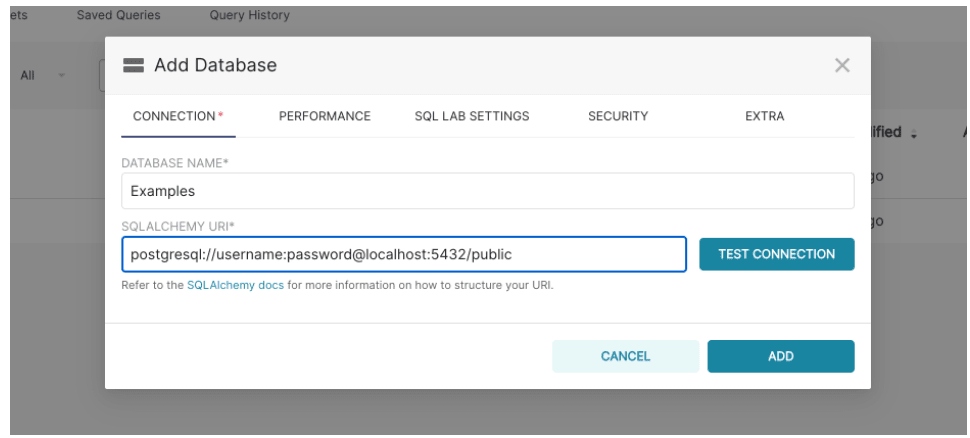
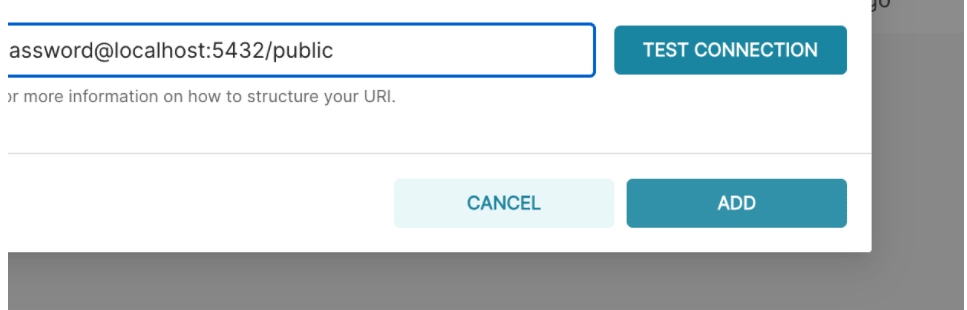
Click on the Test Connection button to confirm if things function seamlessly from end to end. If the connection looks good, you can go ahead and save the configuration by clicking the Add Button in the bottom right corner of the modal window. With this, you have successfully added a new data source in Apache Superset.
Apache Superset offers a thin semantic layer that offers multiple quality of life improvements for Data Analysts. The Superset semantic layer can store two types of computed data:
Virtual Metrics and Virtual Calculated Columns. Virtual Metrics can be used to write SQL queries that aggregate values from multiple columns (for instance, SUM(recovered)/ SUM(confirmed)) and make them available as columns for visualization in Explore view. You can also certify metrics for your team in this view.
Virtual Calculated Columns allow you to write SQL queries that customize the appearance and behavior of a specific column. Aggregate values aren’t allowed in calculated columns.
Step 2: Selecting a Table to be Exposed
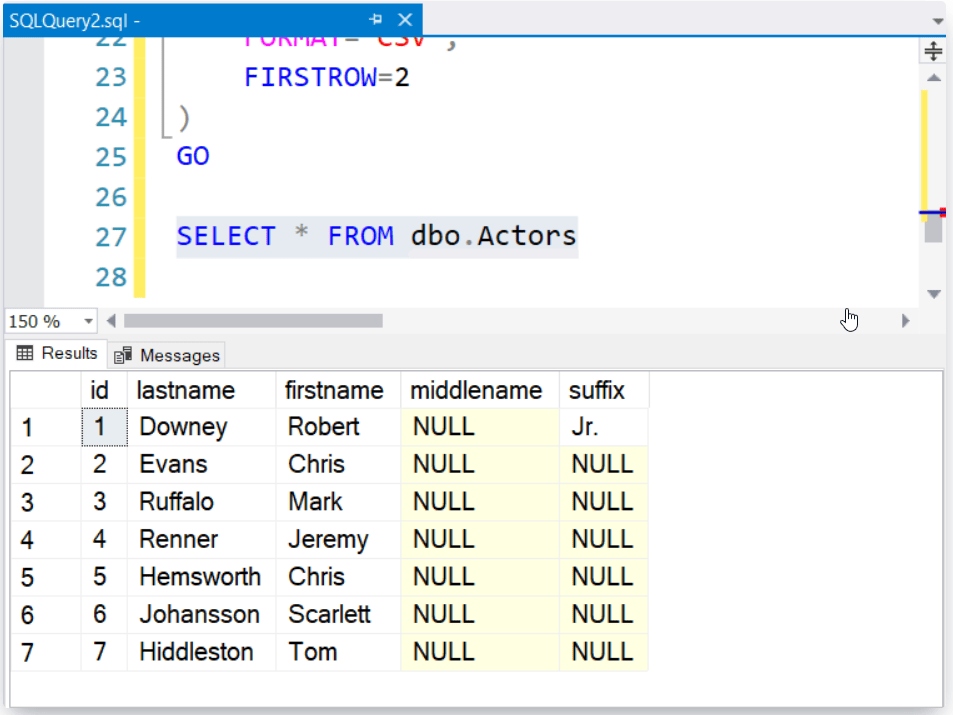
You need to select the specific tables that you want to be exposed to in Apache Superset for querying.
Navigate to Data>Datasets and click on the + Dataset button in the top right corner as follows:
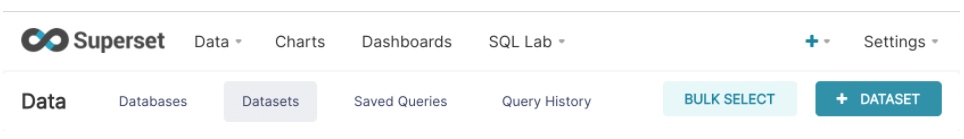
In the modal window that follows, select your Database, Table, and Schema using the given dropdowns. In this example, you can register the cleaned_sales_data table from the examples database.
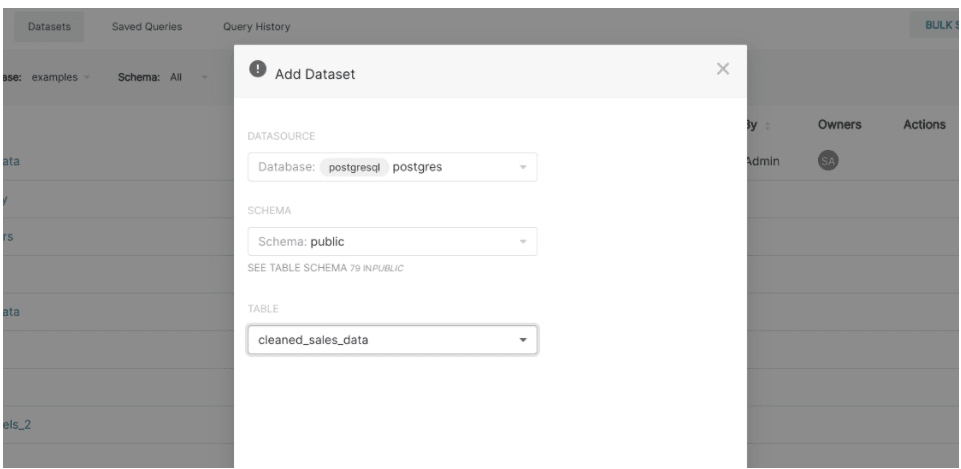
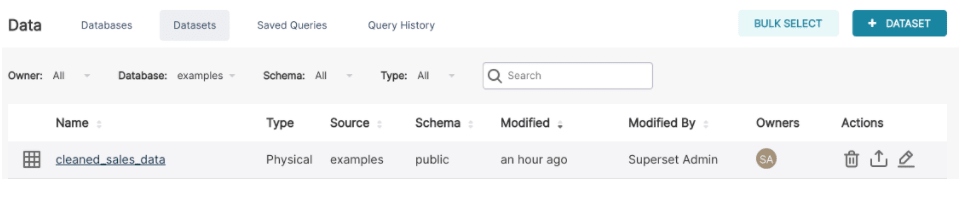
Click the Add button in the bottom right corner to finish this step. You can now see your dataset in the list of datasets.
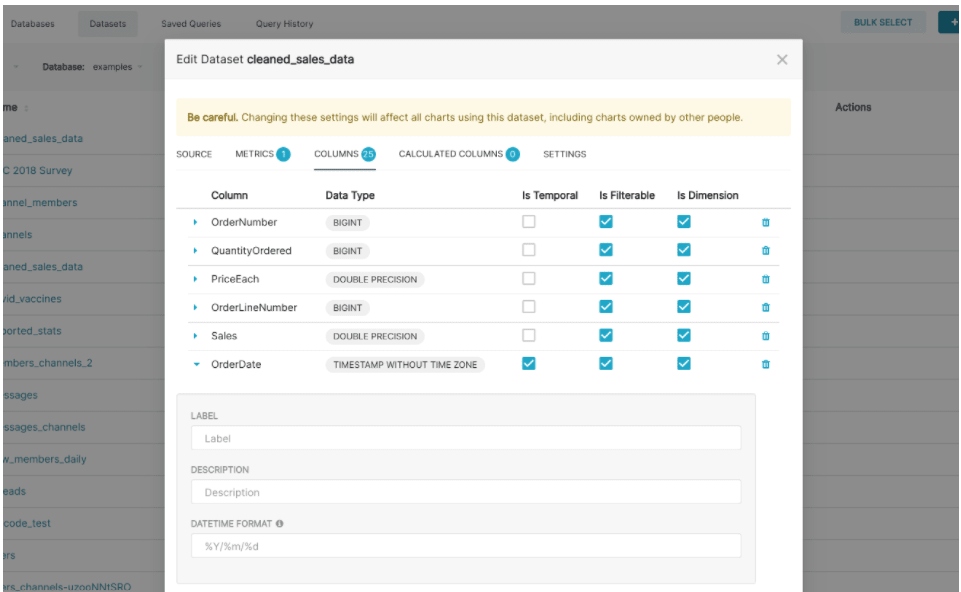
Step 3: Column Properties Customization
After registering your dataset for exposure, you can configure the column properties for how the column should be treated in the Explore workflow:
Step 4: Creating Charts in Explore
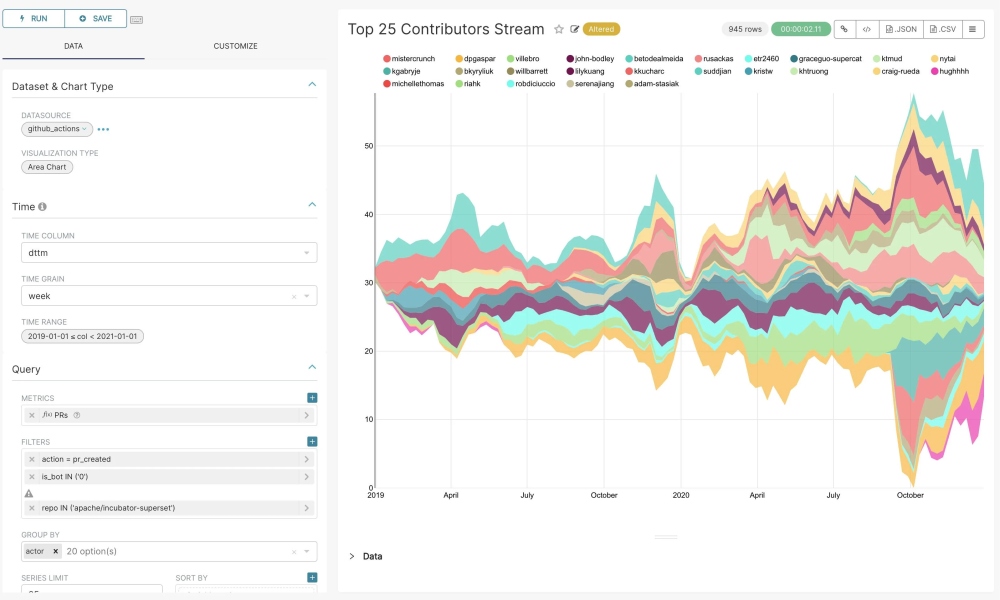
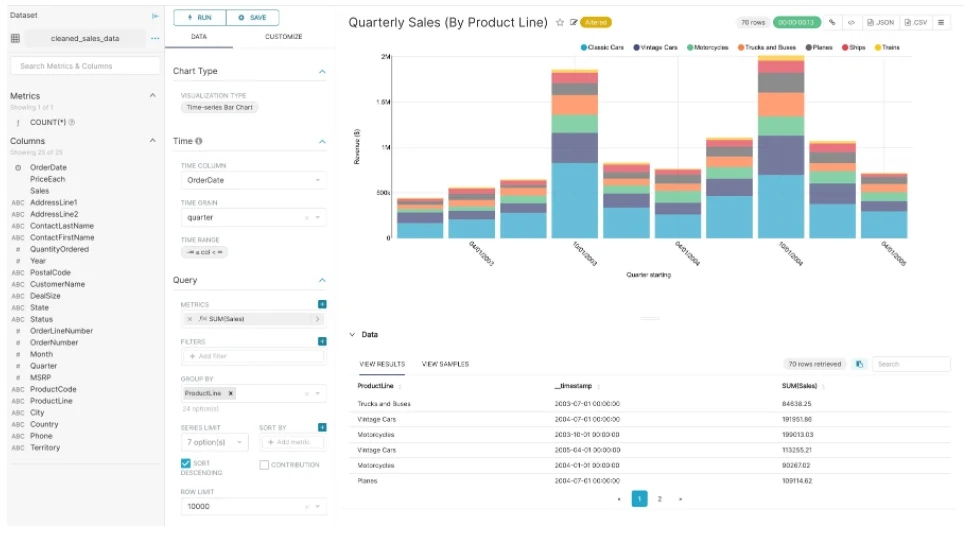
Apache Superset offers two interfaces for exploring data: Explore, the no-code visualization builder, and SQL Lab, which utilizes the SQL IDE for joining, cleaning, and preparing data for the Explore workflow. The Explore workflow allows you to select your dataset, select your chart, customize the appearance of the chart, and publish it. To start the Explore workflow from the Datasets tab, click the name of the dataset that will be powering your chart.
Using the Data and the Customize tabs you can change the visualization type, select the metric to group by, select the temporal column, and customize the aesthetics of the chart. To get visual feedback while customizing your chart using drop-down menus, click the Run button:
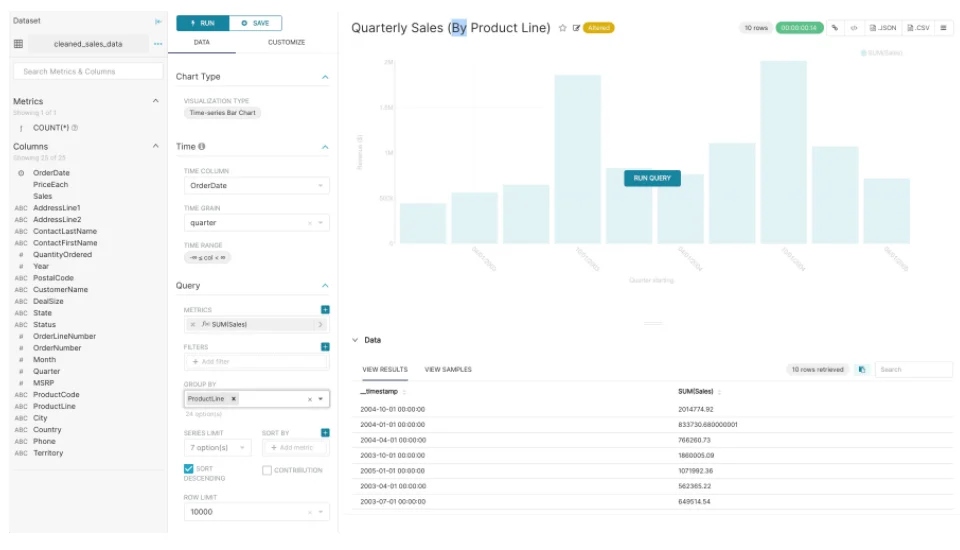
For instance, you can create a grouped Time-Series Bar Chart to visualize your data simply by clicking the options in the drop-down menus as follows:
Step 5: Creating a Dashboard and a Slice
To save your chart, click the Save button which can either save it to an existing dashboard or a new dashboard. Here the chart is being saved to a new dashboard:
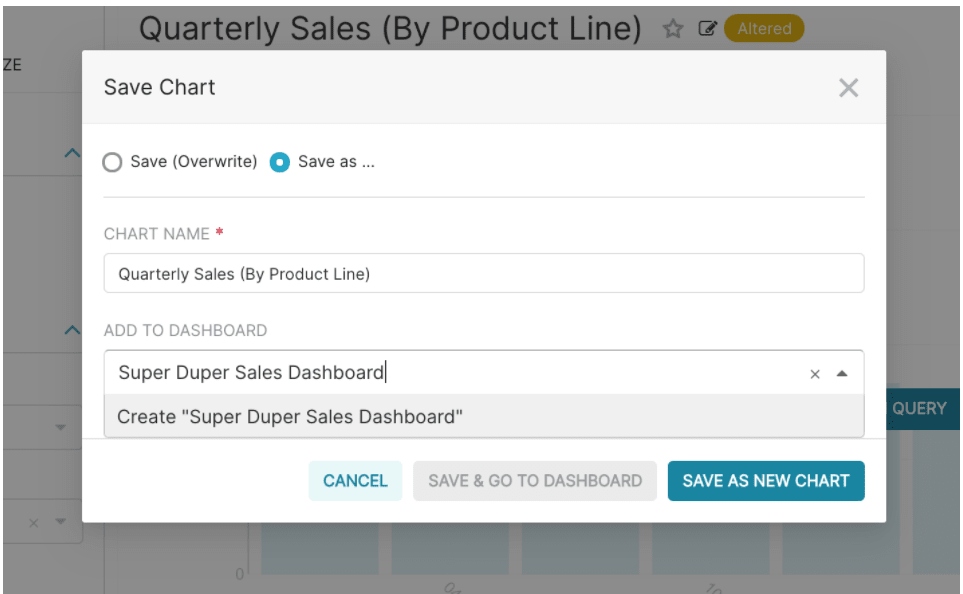
If you wish to publish this, you can click on the Save and goto Dashboard button. Apache Superset creates a slice behind the scenes and stores all the information needed to create a chart in its thin data layer (chart type, query, name, options selected, etc).
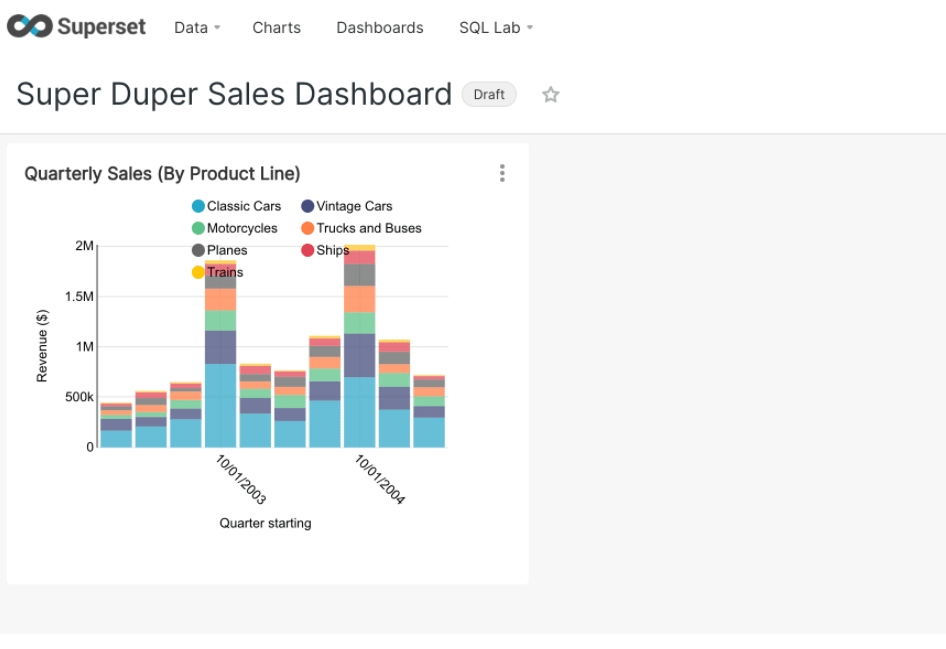
To resize the chart, you can start by clicking on the pencil button in the top right corner:

Next, click and drag the bottom right corner of the chart till the chart layout snaps into a position you like on the grid.
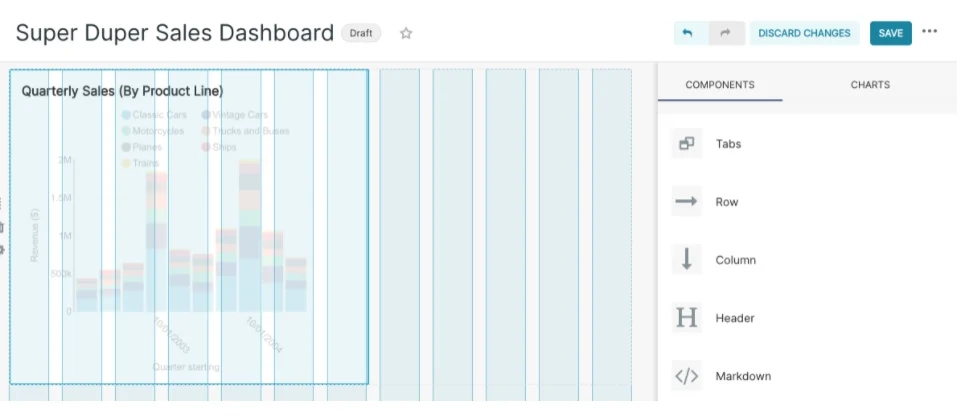
Click on the Save button to persist in the changes. With this, you’ve successfully linked, visualized, and analyzed the data in Apache Superset.
Conclusion
Apache Superset has a simple interface though it is capable of processing and visualizing data quickly. The BI tool is suitable for startups, developing and developed companies. Hence, having learned the features and functions of this tool, you can now decide whether your business needs it or not. If the tool can solve some problems facing your company, it could be a great addition! You may also give the tool a try to see if it can process your data faster than the tool your business uses currently.