Both Kibana and Grafana are data visualization tools providing users capabilities to explore, analyze and visualize data with dashboards. The difference between Kibana and Grafana lies in their genesis. Kibana was built on top of the Elasticsearch stack, famous for log analysis and management. In comparison, Grafana was created mainly for metrics monitoring supporting visualization for time-series databases.
In this article, let’s learn more about these two tools, and understand their differences. But before diving into the differences between Kibana and Grafana, let’s have a look at the tools and their key features.
What is Kibana?
Kibana is the ‘K’ in the popular ELK stack. It is built on top of the popular Elasticsearch stack to explore, visualize, and analyze the log data collected by Logstash and stored by Elasticsearch. Kibana was created in 2013, and since then, it has come to become the frontend for the log management stack provided by Elastic. Kibana provides search and data visualization functionalities on data stored and indexed in Elasticsearch. Though initially built for supporting logs visualization, Kibana now provides charting capabilities for all types of data stored in Elasticsearch. Kibana provides different types of search and query functionalities to perform searches on data indexed in Elasticsearch. Some of the common search methods provided by Kibana include:
- KQL
KQL stands for Kibana Query Language. It supports free text search and field-based searches.
- Boolean Queries
It supports boolean searches with and, or , and not. For example, to match documents with response 200 or extension php, you can write:
response:200 or extension:php
For visualization, Kibana offers most of the common chart types such as bar, area, pie, histogram, and heatmaps.
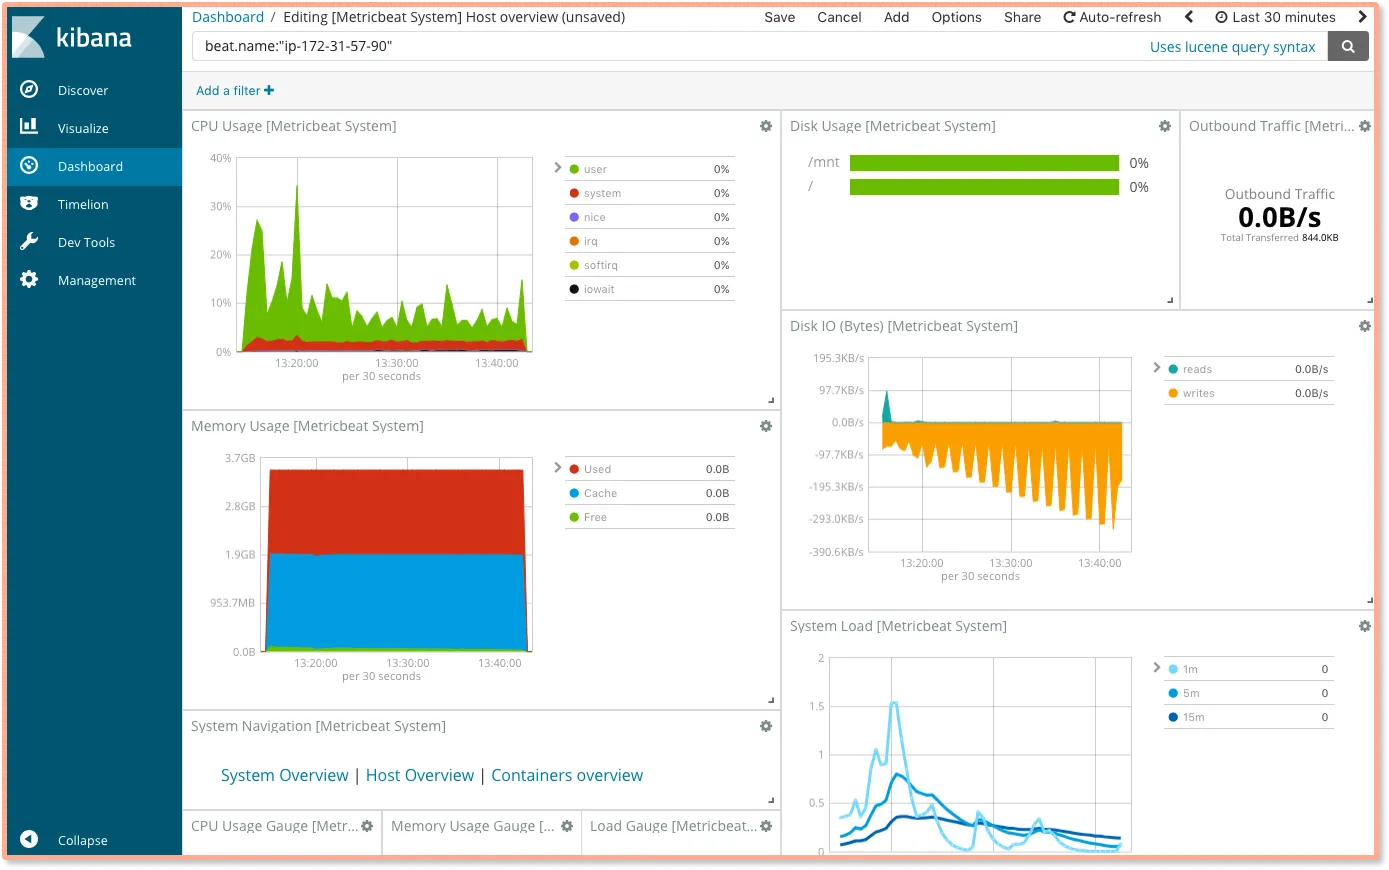
A snapshot of Kibana Dashboard
Key features of Kibana
- Visualization
Kibana provides a lot of ways to visualize data easily. Some of the visualizations that are commonly used are vertical bar charts, horizontal bar charts, pie charts, line graphs, heat maps, etc.
- Search and Query capabilities
Kibana enables its users to perform searches on data indexed in Elasticsearch with intuitive free text and field-based searches. Kibana uses KQL as its default query language to let users perform searches.
- Analysis and data exploration
Kibana provides a tab called Discover to let users explore and analyze data. It is useful for doing ad-hoc analysis on your data when you want specific answers. You can quickly create views from the data, and if you wish, you can also create dashboards.
- Dashboards
When we have the visualizations ready, all of them can be placed on one board – the Dashboard. Observing different data views together can give you a clear overall idea about what exactly is happening.
- Plugins
Kibana also has a lot of plugins available to add new visualization or UI addition from its community-driven plugin modules. For example, there are plugins available for 3D charts and 3D graphs.
What is Grafana?
Grafana is a popular open-source analytics and visualization tool. It was created by Torkel Ödegaard in the year 2014 and is focused on visualizing metrics from time-series databases such as InfluxDB, OpenTSDB, and Prometheus.
Grafana is backed by Grafana Labs, the parent company behind the open-source Grafana.
Grafana lets end-users make complex monitoring dashboards by combining multiple data sources. A brief workflow for creating a dashboard in Grafana involves the following steps:
- Install Grafana
Grafana can be installed on many different operating systems.
- Add a data source
Grafana gives you a dropdown for common data sources like Prometheus, Graphite, InfluxDB, etc.
- Create dashboards
After configuring your data source; you can use the explore view of Grafana and build queries to monitor the metrics you want to track.
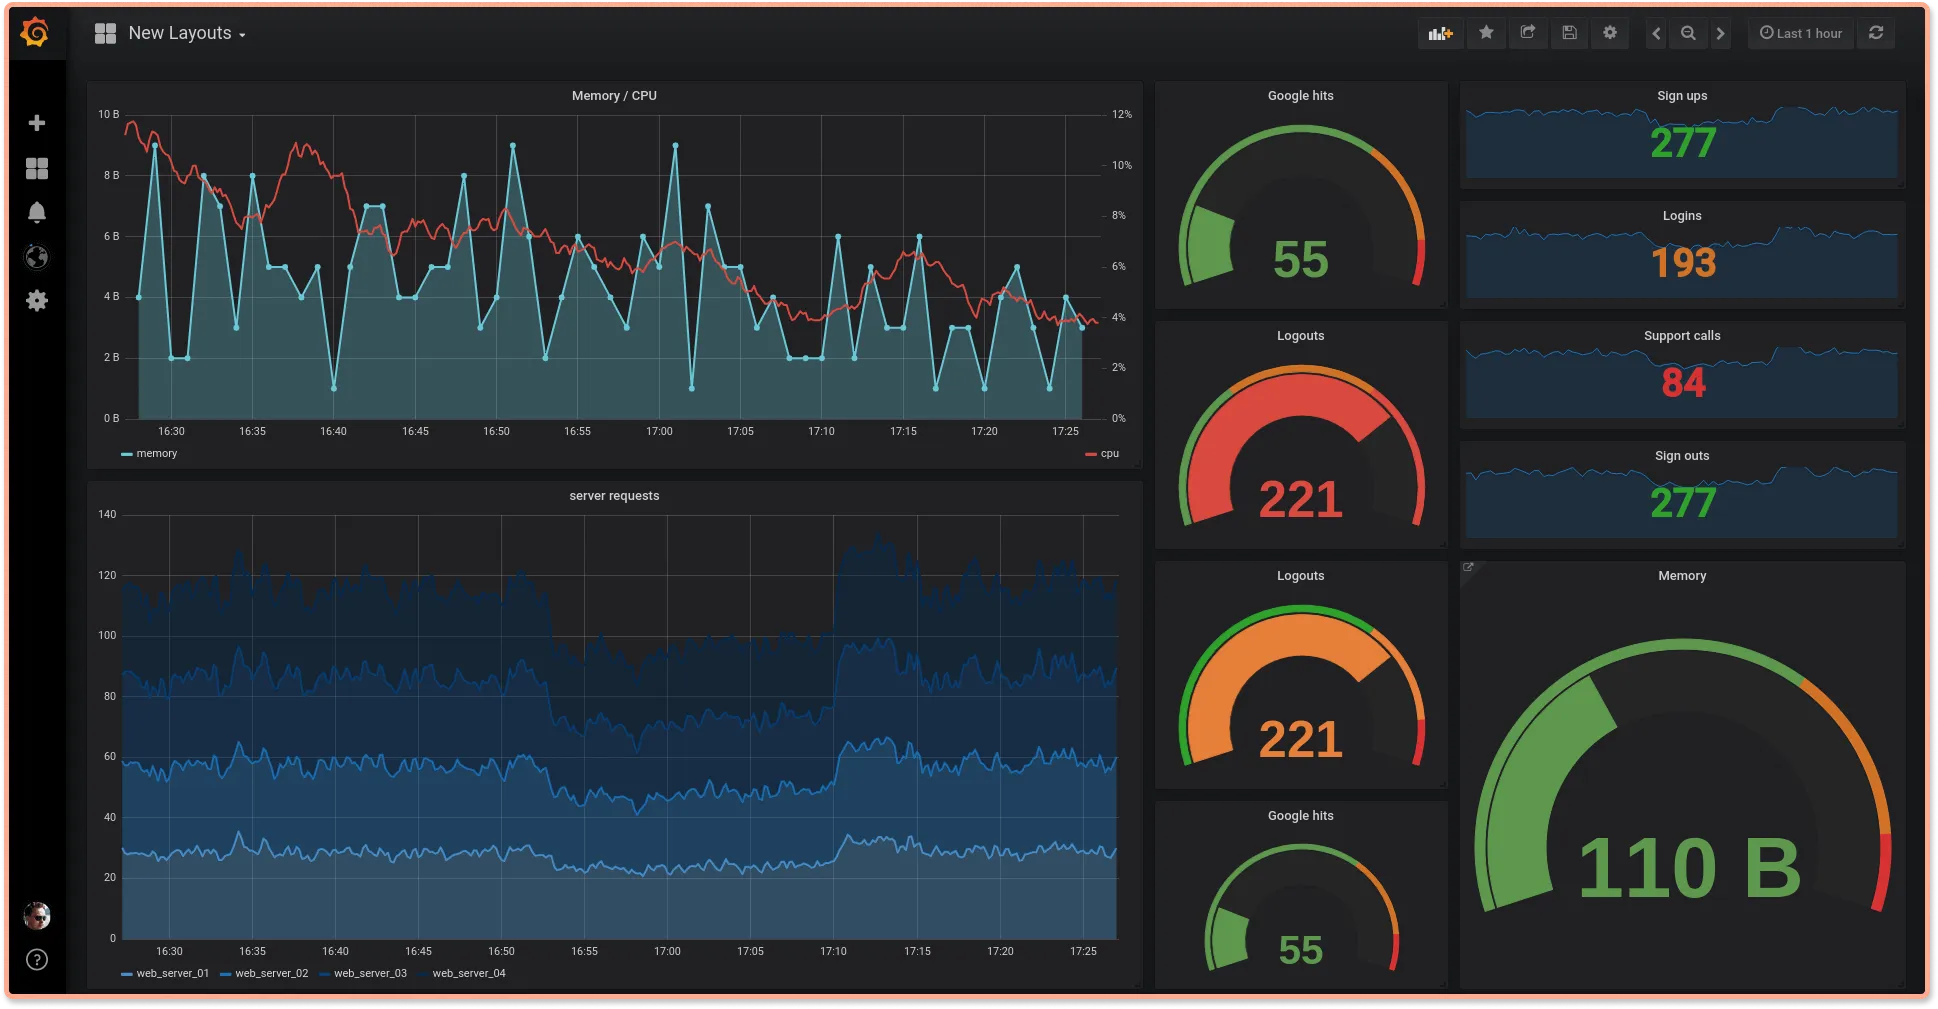
A Grafana dashboard
Key features of Grafana
Some of the key features of Grafana include:
- Visualization Panels
Grafana has a wide range of visualization options like time series, bar charts, heat maps, histograms, graphs, geo-maps, and more that can help users visualize data effectively.
- Data Sources
Grafana supports an extensive list of storage backends for time-series data. It also provides a customized query editor for each data source so that the capabilities of each data source can be fully utilized.
- Unifying Data Sources
In Grafana, you can build dashboards combining multiple data sources. Dashboards contain multiple panels, with each panel corresponding to a specific data source.
- Dashboard Collaboration
Grafana allows users to share dashboard within their organization and also create public dashboards in some cases. It also provides role-based access control features for effective team collaboration.
- Alert Manager
Grafana provides an alerting UI that users can use to set and manage alerts on metrics. It also includes in-built support for Prometheus alert manager. Grafana sends alerts through several different notifiers, including email, PagerDuty, Slack, texts, and more.
Comparing Grafana and Kibana
Differences between Grafana and Kibana at a glance:
[table]
Data sources
Grafana supports multiple data sources like Prometheus, InfluxDB, OpenTSDB, etc. It also supports Elasticsearch as a data source. Focused on visualizing metrics from time-series databases, Grafana officially supports multiple data sources. Here are a few of the popular ones:
- AWS Cloudwatch
- Azure Monitor
- Elasticsearch
- Google Cloud Monitoring
- Graphite
- InfluxDB
- Loki
- MySQL
- Prometheus
- InfluxDB
- Jaeger
- Tempo
On the other hand, Kibana only supports Elasticsearch as a data source.
Dashboard and Visualization
Both Kibana and Grafana offer a great set of visualization capabilities.
Grafana supports graph, single stat, table, heatmap, free text panel types, etc., which can be configured with a variety of data types. Grafana is built for cross-platform visualizations and can integrate data from multiple sources to create dashboards. Each panel in a Grafana dashboard corresponds to a specific data source, but multiple panels with different data sources can be combined to create a rich dashboard.
Kibana offers a wide variety of visualization types, allowing you to create pie charts, line charts, data tables, single metric visualizations, geo maps, etc. Apart from the basics, Kibana also provides visualizations for the following analyses:
- Location analysis
- Time series analysis
- Machine learning
Kibana’s discover feature let users explore and analyze data quickly.
Alerts
Grafana comes with Grafana alerting UI to create and manage alerts. Using alert rules in the Grafana dashboard, you can set evaluation criteria that determine whether an alert should be fired or not. It also provides features to organize your alert rules with role-based access controls.
Kibana does not directly handle alerts. They are configured in Elasticsearch using data watchers. Watcher is an Elasticsearch feature that allows you to build actions based on conditions that are assessed on a regular basis using data queries and take action based on the results. At the moment, the API is the only way to set up watches.
Query
Grafana provides a query editor for writing queries. With the help of queries, Grafana panels interact with the underlying data source. The syntax of the query depends on the connected data source. For example, in the picture below, the connected data source is InfluxDB, and the query syntax will be based on what the data source provides.
Each data source has its own query language.
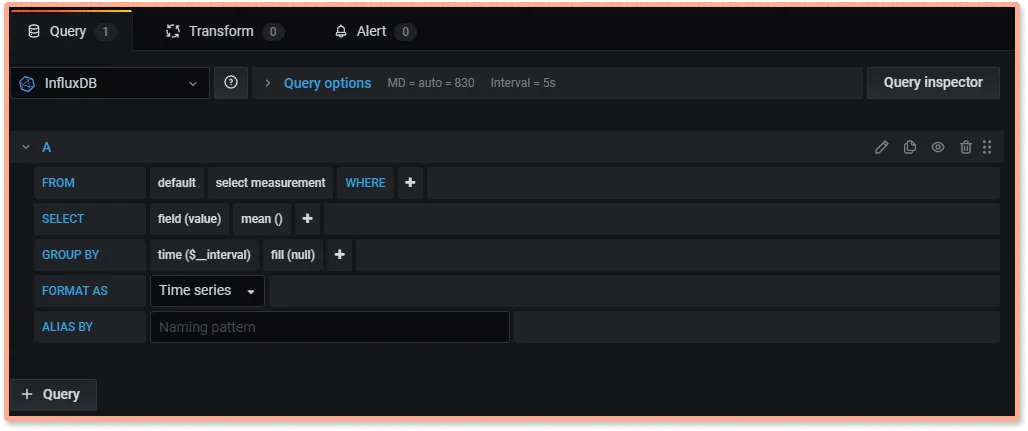
InfluxDB query editor on Grafana (Source: Grafana Labs website)
Kibana in turn uses the Elasticsearch Query Language for making queries.
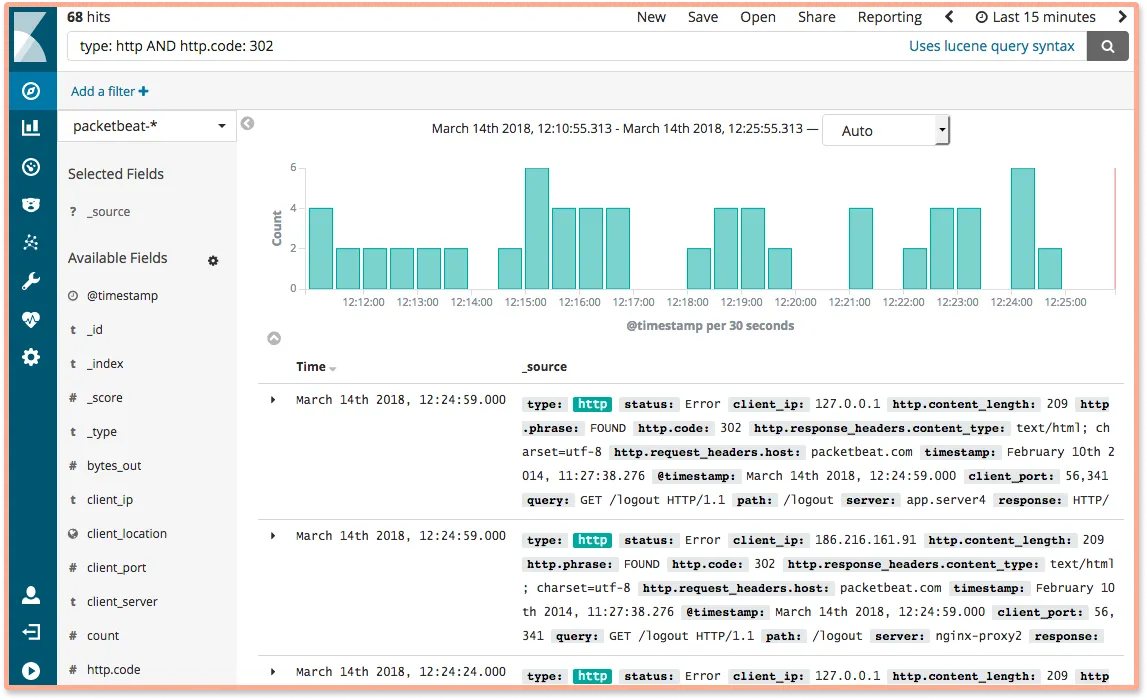
Using KQL, you can explore the data indexed in Elasticsearch using free text search and field-based search (Source: Elastic website)
Which is better Kibana or Grafana?
Both Kibana and Grafana have rich capabilities when it comes to data visualization. Depending on your use case, you can select one over the other. If your data source is Elasticsearch, it makes sense to choose Kibana over Grafana. Grafana does provide integrations to add Elasticsearch as a database, but Kibana was built specifically for the Elastsearch stack.
On the other hand, if you want to visualize metrics from a time-series database, Grafana provides a better user experience.
Both Kibana and Grafana have expanded beyond the scope of their initial offerings, and they now provide support for different types of data. For example, Grafana now supports log visualization collected by Loki - a log aggregation tool by Grafana Labs. Likewise, Kibana also supports metrics and tracing visualization.
An open-source full stack APM - SigNoz
Modern observability trends show that for effective monitoring of application, all your telemetry signals should be under a single pane of glass. Both Grafana Labs and Elastic, the companies behind Grafana OSS and Kibana offer observability solutions by stitching together multiple tools. For observability, these three signals are considered important:
The above three signals are popularly known as the three pillars of observability. The easier a tool makes it to get started with these three signals, the better. Grafana Labs provide multiple solutions to collect and monitor logs, metrics, and traces. You need to stitch together the following three tools for a full-stack observability solution:
- Loki for logs
- Prometheus - Grafana combo for metrics
- Tempo for traces
Elastic, on the other hand, provides Elastic APM, its observability solution meant for cloud-native applications. The cloud-native ecosystem is moving towards open standards for application instrumentation. OpenTelemetry, a Cloud Native Computing Foundation project is quietly becoming the world standard for instrumenting cloud-native applications.
It provides client libraries in multiple programming languages to generate telemetry data(logs, metrics, and traces) from applications. If you use OpenTelemetry, you can choose a backend analysis tool of your choice to store and visualize your observability data. And that’s where SigNoz comes into the picture.
SigNoz is an open-source APM that is built natively on OpenTelemetry. It provides metrics monitoring, distributed tracing, and logs(currently under active development), everything under a single pane of glass.
It comes with out-of-box application metrics charts.
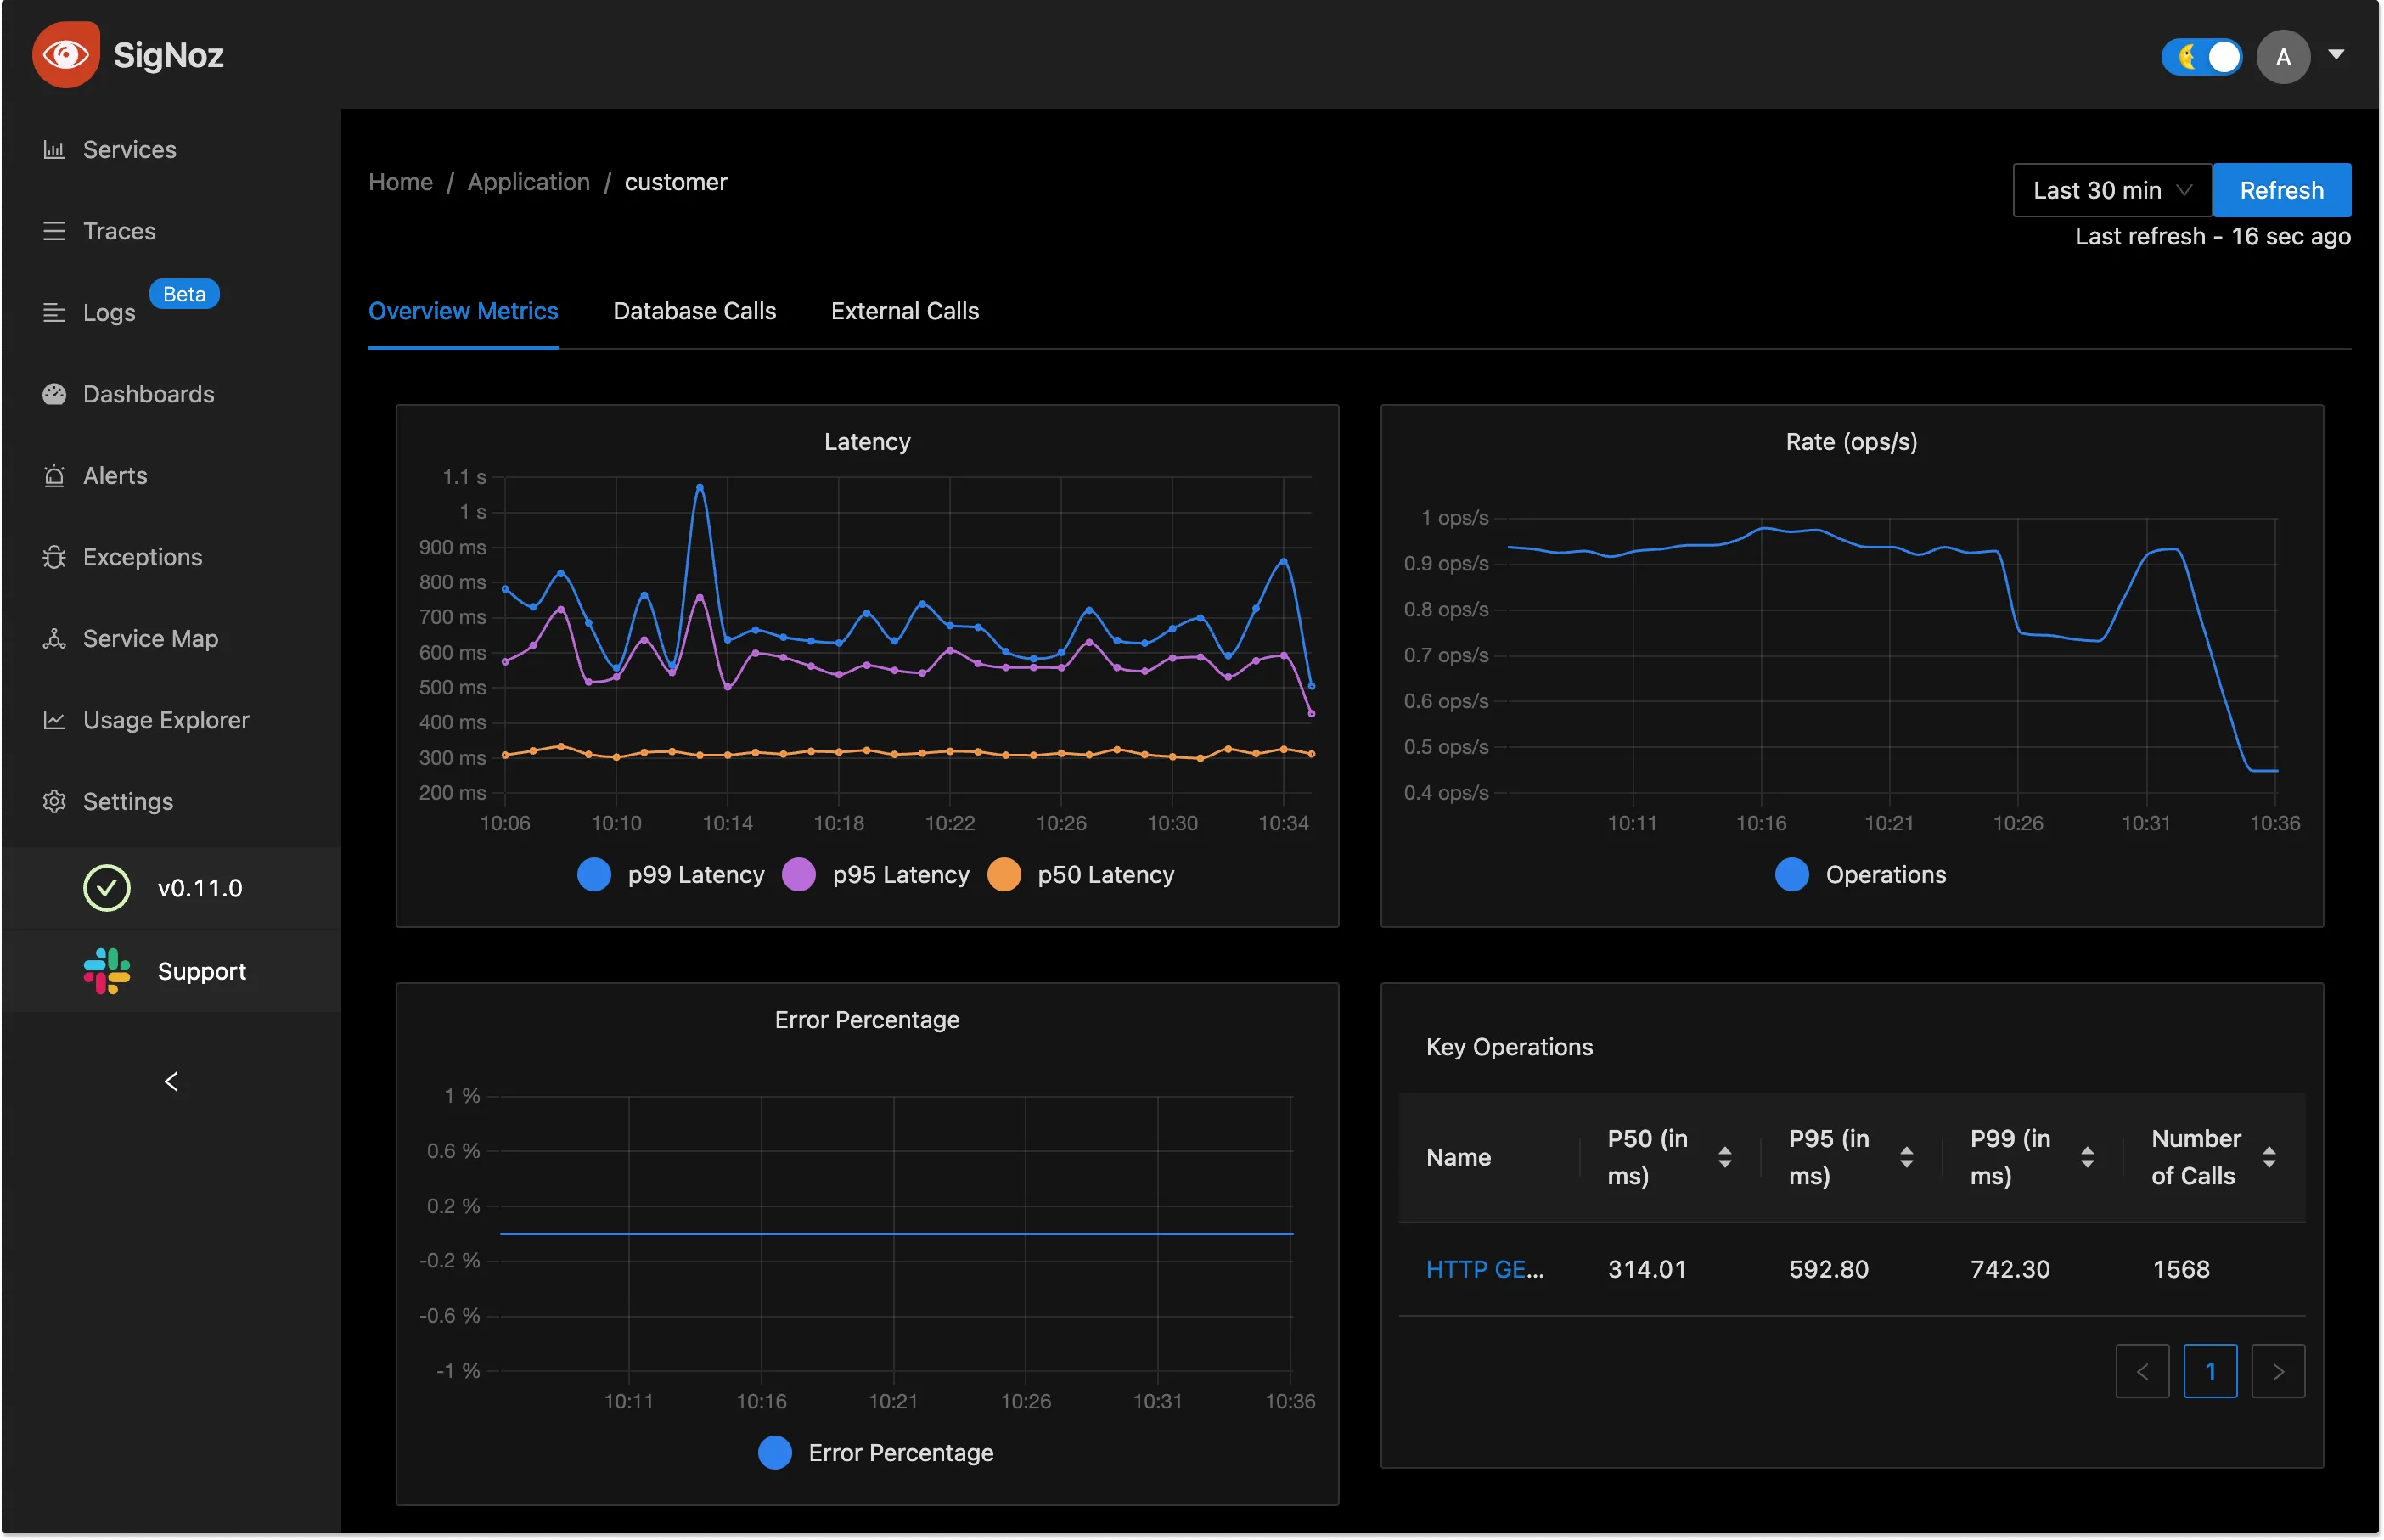
SigNoz UI showing application overview metrics like RPS, 50th/90th/99th Percentile latencies, and Error Rate
Using Flamegraphs and Gantt charts, you can see a complete breakdown of user request.
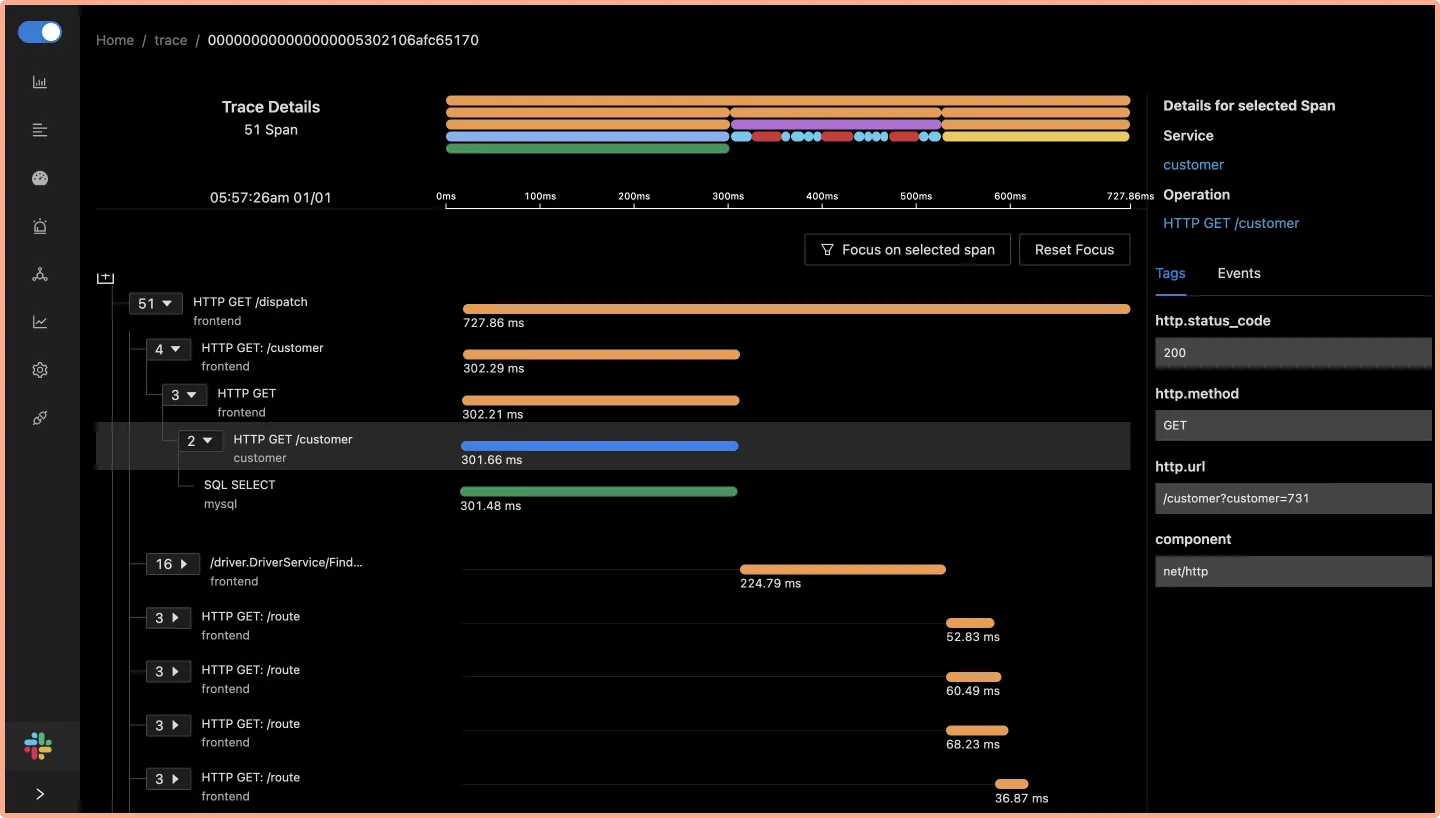
Flamegraphs and Gantt charts in SigNoz dashboard
FAQs
Is Kibana open-source?
No, Kibana is not open-source. Elastic, the company behind Kibana, now calls it open code, having shifted Kibana from the popular open-source license Apache 2.0 to a dual license scheme - Elastic License and Server Side Public License (SSPL). Under this license, cloud service providers can not provide Elasticsearch and Kibana as a service. You can read more about this license here.
Is Kibana free?
Kibana is free to use under the Elastic license or SSPL with certain features.
What is the main difference between Kibana and Grafana?
While Kibana was built on top of the Elasticsearch stack, famous for log analysis and management, Grafana was created mainly for metrics monitoring, supporting visualization for time-series databases.
Is Grafana a fork of Kibana?
Yes, Grafana started out as a fork of Kibana to expand its visualization capabilities for time-series databases.